
Explainer: How much did climate change ‘cost’ in the 20th century?
Roz Pidcock
03.01.17Roz Pidcock
01.03.2017 | 8:00amFrom heatwaves to hurricanes, working out the dollar cost of climate change is a tough task. Often used by policymakers to weigh up the costs and benefits of tackling rising emissions, the topic is not without controversy. A recent study suggesting that human-caused climate change brought benefits in the 20th century offers a good starting point to explore a few of the issues that surround this fraught, complex topic.
The research, published in the journal Public Library of Science, claims the world has experienced a “significant drop” in estimated climate impacts “since the late 1990s” and that the tendency for models to ignore natural fluctuations, not caused by greenhouse gases, could be “biasing the estimates”.
But climate scientists and economists that Carbon Brief spoke to say the study’s conclusions don’t stack up. What’s more, the paper’s odd use of outdated assumptions, old datasets and now-defunct models serve to muddy this already tricky-to-navigate subject.
Version control
![]()
The study uses a type of model that blends climate science and economics to retrospectively work out the cost of climate change in the 20th century. Known as Integrated Assessment Models (IAMs), these work by assigning monetary values to expected climate impacts at different levels of warming.
The authors use three different IAMs: DICE (Dynamic Integrated Climate-Economy model), developed by William Nordhaus, a professor of economics at Yale University; PAGE (Policy Analysis of the Greenhouse Effect model), developed by Chris Hope from the University of Cambridge; and FUND (Framework for Uncertainty, Negotiation and Distribution model), originally developed and now co-managed by Richard Tol, a professor at the University of Sussex and co-author on the new study.
Over time, all three models have been continually updated to reflect the evolving science on things such as climate sensitivity, adaptation, ice sheet melt and sea level rise. Despite the authors of the new paper stating that they employ “the most widely used IAMs”, they actually select outdated versions.

Agricultural wheeled irrigation sprinkling system in California Desert near a dirt road and a newly planted citrus grove.
Credit: NicolasMcComber/iStock/Getty Images
The study uses a version of PAGE from 2002 despite the fact that the model was “greatly revised” in 2009 following the Stern Review, raising the average cost of one additional tonne of CO2 – known as the social cost of carbon – from $81 per tonne to $106 per tonne. Hope tells Carbon Brief he doesn’t know why the authors would use an old version as the new one “has been freely available for over six years now”.
The study uses two old versions of the DICE model – dating back to 1999 and 2007 – which have since been superseded to include, among other things, a higher cost of climate damages. (Note: The most recent update to DICE was in late 2016, but this was after the new paper was submitted for publication.)
The authors also use an earlier version of their own model, FUNDn3.6, developed in 2012. This is despite three updates between then and the time the paper was submitted for publication.
When asked about the reasons for using these earlier model incarnations, Tol told Carbon Brief there were “no material differences between the older model versions and the new ones that would lead to a qualitative change in our conclusions”. Nordhaus appears to hold a different view, telling Carbon Brief.
“There have been substantial changes since that time. I don’t know why they didn’t use the later ones.”
Dr Frank Ackerman, a principal economist at Synapse Energy Economics who has written extensively about the economics of climate change, agrees with Nordhaus. He tells Carbon Brief:
“The newest versions of DICE and PAGE have significantly different (more ominous) damage functions, compared to the obsolete versions cited in this paper. The statement that there are no material differences between older and newer models is simply untrue.”
Model skew
The authors’ specific model choices are important because what they each show about climate impacts in the 20th century has a critical bearing on the study’s conclusions.
The graph below from the paper shows the economic impact of human-induced warming in the 20th century. Two of the models – DICE99 (light green) and FUND (orange) – show rising economic benefits (increasing GDP), while DICE2007 (red) and PAGE2002 (dark blue) show net economic costs.
(Note: The light blue line is a meta analysis (“MA”) compiled by Tol in 2009, which pulls together the results from many different IAMs. It includes a number of corrections to previous errors. The dark green line is an “equity weighted” version of FUND, shown in the paper for comparison but not included in the results.)
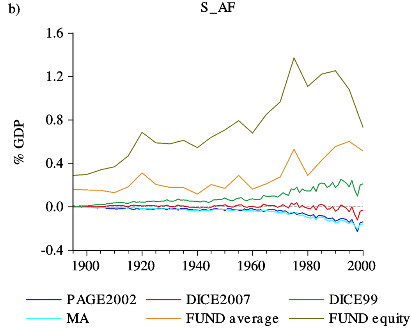
Economic effects of human-induced radiative forcing over the 20th century, according to different Integrated Assessment Models (IAMs) and a meta analysis (Tol, 2009). Ignore the dark green line, it is an “equity weighted” version of FUND shown in the paper for comparison but not used in the analysis. Source: Estrada et al., (2017)
The basis of the paper’s conclusion that “the human contribution to the observed warming during the 20th century produced net benefits in the world average” is based on taking the average of the four models and the meta-analysis. Doing so leads to the following finding:
“The benefits increased from about 0.08% at the beginning of the century to about 0.19% of GDP in 2000 after reaching about 0.33% in the 1990s.”
But, as discussed above, DICE has undergone substantial revisions since the 1999 version used in this analysis. Later versions, as evidenced by DICE2007 (red line in the graph above), do not show a net increase in GDP, leaving FUND as the only model supporting the paper’s conclusion that climate change “produced net benefits” in the 20th century.
Nevertheless, the graph below from the paper shows the outcome of taking the average result across all models – a net economic benefit that rises over the course of the century (solid line). The blue shading is the uncertainty range, reflecting the fact that the models straddle both positive and negative impacts.
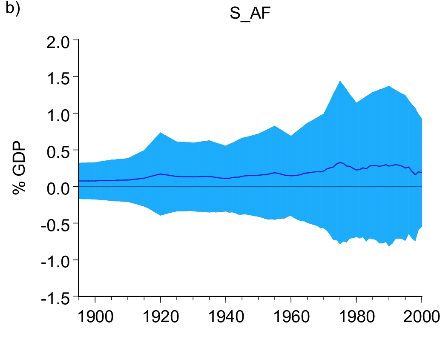
Multi model mean of the economic effects of human-caused radiative forcing in the 20th century. Source: Estrada et al., (2017)
Credibility question
Dr Richard Rosen, a former fellow and a founding member of the Tellus Institute, a not-for-profit research and policy outfit, says that while the paper acknowledges “very large uncertainty” between the different models, it does not make clear the extent to which just one of the five – Tol’s FUND – dominates their conclusion. In a comment under the online version of the paper, Rosen says:
“They do not provide a convincing analysis of the IAMs relied on, especially of the FUND model, to show that the way in which the model responds to temperature change to calculate “impact” is credible.”
Tol responded to Rosen’s comment to say:
“As we argue in the paper, impact models cannot readily be validated, if at all, as impacts have not been measured in the past and will not in the future. As to the respective credibility of IAMs, FUND includes more of the established empirical regularities on impacts and vulnerability than do the other IAMs.”
The paper weights all the models equally, implying that “all of them produce equally credible estimates”. But FUND has been slow to upgrade to the latest science, Ackerman tells Carbon Brief:
“In some important areas, such as agriculture, FUND continues to rely on 1990s research, which is quite at odds with newer (and more ominous) research findings.”
This is significant since the authors note in the paper that the effect of human-induced warming on agriculture “accounts for most of the economic benefit in the past century” in the FUND model. It is also worth noting that the FUND website says the model “reflects its developer’s world views” and is, therefore, “regularly contrary to the rhetoric of politicians and occasionally politically incorrect”.
‘Crude’ choices
There is another irregularity about the paper worth highlighting. As well as concluding that human-caused warming had net benefits over the 20th century, the study finds that the warming effect slowed “since the early 1990s”, with knock-on effects for the severity of climate impacts later in the decade.
To arrive at this conclusion, the authors take the observed record of global temperature and strip out the contribution from all known factors that affect temperature, both natural and human, leaving the “noise” of natural variability. Then, they separate out the contribution to warming from natural factors, such as variations in solar and volcanic activity. Their estimate of human contribution to warming is effectively what’s left once they minus both of these natural components from the observed temperature.
The first thing to note is that, for no apparent stated reason, the authors use the Met Office/University of East Anglia’s HadCRUT3 dataset rather than the updated HadCRUT4, which includes better coverage of global temperature and, as a result, slightly faster warming in the 20th century.
Prof Reto Knutti, from the Swiss Federal Institute of Technology in Zurich, tells Carbon Brief:
“The use of HadCRUT3 is indeed strange and introduces some artefacts…Using a dataset that is outdated is not good science…Overall, this seems a rather crude way of doing things.”
Old aerosol assumptions
A further strange choice comes in the way the authors work out the extent to which human activity influences global temperature in the last decade of the 20th century.
The paper uses a well-established concept known as “radiative forcing“. As greenhouse gases have accumulated in the atmosphere over the industrial period, the radiative forcing has increased – or got more positive – causing global temperatures to rise. Aerosols – tiny particles suspended in the air – exert a cooling effect and have offset some of this warming.
It’s worth noting, however, that the authors use radiative forcing values from a study led by Dr James Hansen in 2011, which makes an assumption about aerosols rather than using actual emissions data. At the time of the Hansen paper, the latest thinking was that aerosols had increased during the 1990s, offsetting around half of the warming coming from greenhouse gases.
In the years since then, there has been a substantial rethink. In the modelling work that underpins the latest Intergovernmental Panel on Climate Change (IPCC) report, aerosols decrease rather than increase after 1990. Since they have a cooling effect, this drop in aerosols translates to an extra boost to warming.
This new and improved data has been available since 2013. (There are even details of the newer aerosols data on the same webpage that the study links to, just a little higher up the page.)
The result of the authors’ use of an old aerosols dataset is to lowball the human component of observed warming. This would seem to not only underestimate the likely impacts, but also make the influence of natural variation seem large against the background trend of human-induced warming. Carbon Brief asked lead author Dr Francisco Estrada, from the National Autonomous University of Mexico, whether he had re-run his analysis with more recent radiative forcings. He told us:
“I think it is important to understand that there is no end to the combinations you can get from all the different datasets there are…Given the similarity of these characteristics, I see no point in repeating the analysis in the PLoS One paper we just published.”
Incidentally, a paper published since the new study describes the very latest emissions data that will feed into the next IPCC report due in 2020. It finds an even more pronounced effect from aerosols, saying:
“Our key finding based on the updated model simulations is that there is stronger positive radiative forcing of aerosols and ozone over the past 25 years than reported in IPCC AR5.”
In other words, should the authors re-run their analysis with the most up-to-date aerosols data, they would find more warming in the 1990s – the decade on which at least part of their conclusion hangs.
Sensitivity
As for the paper’s comparison of the impacts attributable to natural variability and human-caused climate change in the 20th century, Rosen says the models are not sensitive enough to draw such conclusions. He tells Carbon Brief:
“It is crazy that the authors would be so preposterous as to make the claims they do…Even the more detailed models could not possibly hope to compute the economic impact of small variations in temperature.”
Rosen’s own work includes a 2014 review of attempts to weigh up the net costs and benefits of mitigating climate change, in which he suggests that the “various kinds of uncertainties” inherent in such activities mean they should be reported more carefully to policymakers and the public, if at all.
Ackerman agrees, telling Carbon Brief that estimating damage functions in IAMs can only ever be an approximation of reality. He says:
“The best-known IAMs, DICE, PAGE and FUND, have been cited so frequently, often by their developers (as in this case, coauthored by FUND developer Richard Tol), that they have created a self-referential literature.”
IMO (despite well-meaning effort by DICE/FUND/PAGES authors) these kinds of model aren't fit for purpose in estimating economic damages 5/n
— Gavin Schmidt (@ClimateOfGavin) February 28, 2017
You can read Carbon Brief’s recently published Q&A on the social cost of carbon for a more detailed look at what is and isn’t included in IAMs. They have faced criticism for failing to capture climate impacts that are hard to attach a monetary value to, such as civil conflict and human migration. Others, such as biodiversity loss and ecosystem services, are only included partially, or in some models, but not others.
Notwithstanding these limitations, the social cost of carbon is a critical metric that underpins climate regulations in a number of countries, including the US, whose new administration may seek to amend it. Against such a backdrop, this paper serves to highlight how far personal choices, old data, obsolete models and outdated assumptions can affect the “cost” that economics models apportion to climate damages.