Explainer: How the rise and fall of CO2 levels influenced the ice ages
Zeke Hausfather
07.02.20Zeke Hausfather
02.07.2020 | 4:00pmThe Earth’s climate has been quite stable over the past 11,000 years, playing an important role in the development of human civilisation.
Prior to that, the Earth experienced an ice age lasting for tens of thousands of years. The past million years of the Earth’s history has been characterised by a series of ice ages broken up by relatively short periods of warmer temperatures.
These ice ages are triggered and ended by slow changes in the Earth’s orbit. But changing atmospheric concentrations of CO2 also plays a key role in driving both cooling during the onset of ice ages and warming at their end.
The global average temperature was around 4C cooler during the last ice age than it is today. There is a real risk that, if emissions continue to rise, the world warms more this century than it did between the middle of the last ice age 20,000 years ago and today.
In this explainer, Carbon Brief explores how the last ice age provides strong evidence of the role CO2 plays as a “control knob” for the Earth’s climate. It also acts as a cautionary tale of how the climate can experience large changes from relatively small outside “forcings”.
Milankovitch cycles
The Earth has experienced a number of periods over the past million years in which large continental ice sheets have covered much of the northern hemisphere. These ice ages are associated with a large drop in global temperatures – 4C or more below today’s levels – with much larger changes over land and in the high latitudes.
These ice ages are punctuated by “interglacial” periods where temperatures rise to around current levels. The most recent ice age occurred between 120,000 and 11,500 years ago, while the current interglacial period – the Holocene – is expected to last for additional tens of thousands of years (and human activity may inadvertently delay the start of the next ice age even further).
Ice-age cycles are primarily driven by periodic changes in the Earth’s orbit. Three distinct orbital cycles – called Milankovitch cycles after their discoverer, Serbian scientist Dr Milutin Milankovitch – interact to change the distribution of incoming solar energy in ways that can dramatically affect the Earth’s climate.
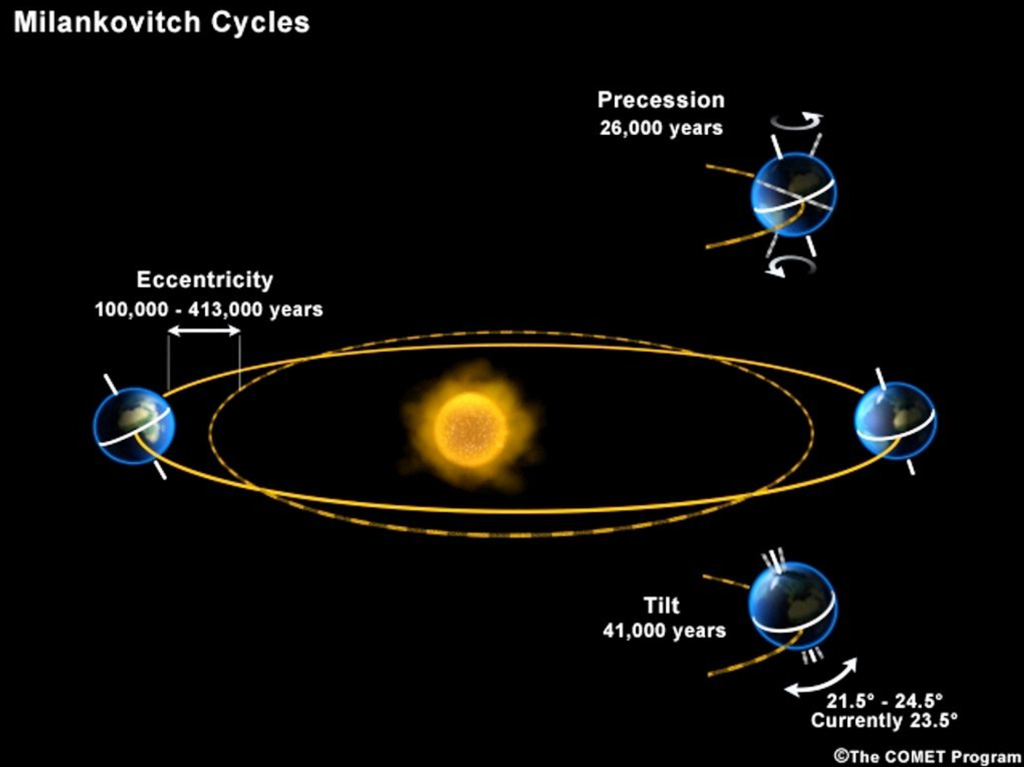
These include:
- Precession – a 26,000-year shift in the orientation of Earth’s axis of rotation that affects how much summer sun is received at high latitudes (and shifting how much reaches the north vs south).
- Obliquity – a 41,000-year change in the tilt of the Earth’s axis relative to the sun that changes how much sun is received during a year at the poles versus the equator.
- Eccentricity – a 100,000-400,000 change in the shape of the Earth’s orbit around the sun that alters the length of the seasons and affects the importance of precession.
These three cycles overlap in different ways over time given their different periods, which means that ice ages do not always have the same duration. None of these cycles substantially changes the total amount of energy reaching the Earth from the sun; rather, they mostly act to change the distribution of the sun’s energy across the surface of the Earth.
When these cycles cause the northern latitudes to get less sun in the summer, it allows ice sheets to begin to expand. These ice sheets in turn reflect more incoming sunlight back to space, resulting in a “positive feedback” that drives additional regional cooling.
The northern latitudes matter much more than the southern latitudes – at least over the past few million years – as it contains more land area (which can more easily become ice-covered than the oceans) and because the Antarctic has remained covered in ice.
Greenhouse gases
These shifts in the distribution of sun’s energy across the Earth’s surface are not enough to explain the dramatic changes to the climate during ice ages, particularly outside high-latitude regions.
Changes in atmospheric greenhouse gas concentrations – and, in particular, CO2 – play a large role in the development of cold conditions during ice ages and warm conditions during interglacial periods. In this case, CO2 is not the immediate cause of ice ages; rather, it serves as a feedback to amplify changes initiated by orbital variations.
There is a well-known correlation between temperatures and CO2 concentrations over glacial periods. The figure below shows both temperatures (red line) – reconstructed from hydrogen isotope analysis – and atmospheric CO2 concentrations (blue line) from air bubbles trapped in Antarctic ice over the past 800,000 years.
(These ancient air bubbles are accessed by drilling ice cores down through ice sheets and glaciers. Ice cores are just one example of “proxy data”, where climate information from the distant past is gathered from indirect evidence that is locked up in various forms across the Earth.)
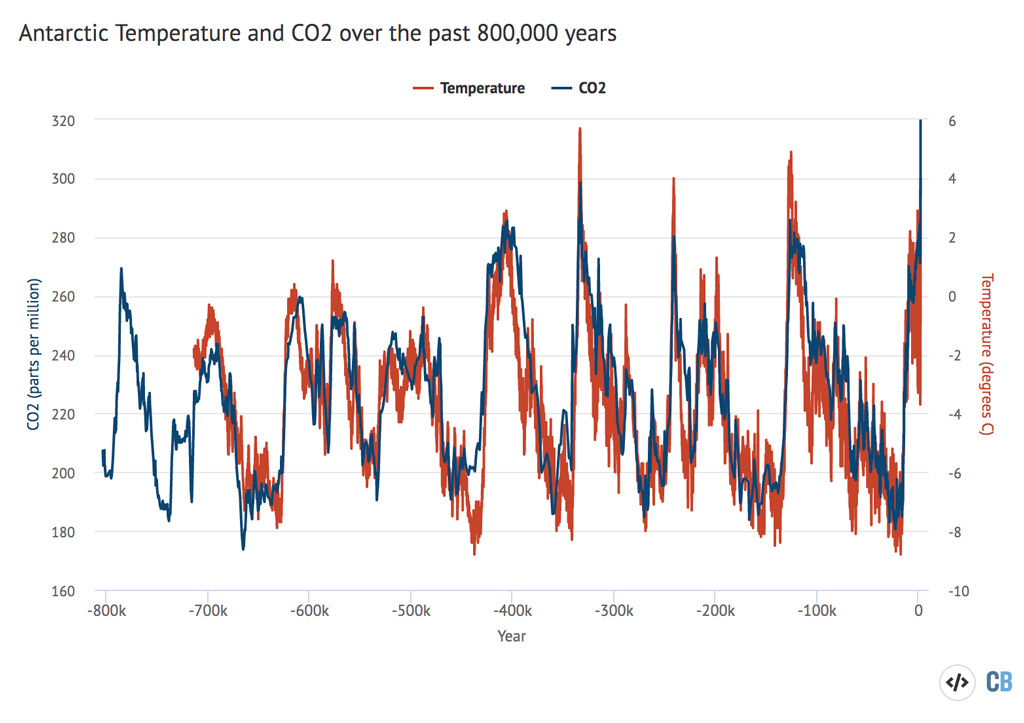
While the CO2 concentrations provide a good representation of global average values – as CO2 is a well-mixed greenhouse gas – it is important to note that the temperature reconstruction shown here only represents Antarctica. There is strong evidence from climate proxies around the world during the last glacial period global showing that temperatures fell considerably less – around half as much – as Antarctic temperatures.
Changes in orbital cycles do not immediately cause rises or falls in atmospheric CO2. Rather, initial increases in ice cover in high-latitude areas trigger feedbacks that cause atmospheric CO2 to fall at the start of ice ages.
This happens in a multitude of ways. As ice sheets grow, sea levels change dramatically, falling around 120 meters compared to today’s levels and exposing large areas of land currently underwater and allowing growing vegetation to take up more CO2.
Colder ocean water dissolves more CO2, absorbing more from the atmosphere, though this is somewhat offset by the effect of higher salinity on ocean CO2 absorption – as fresh water from snow freezes into ice sheets.
In addition, ice-age glaciers grind up rocks into dust that provides nutrients to ocean life, helping boost the amount of carbon in the deep ocean as plants get eaten and sink into the ocean.
Expanded sea ice also covers up regions of the ocean where upwelling helps bring deep-ocean CO2 back up to the surface, limiting the amount of CO2 that can be released from the oceans back into the atmosphere. Changes to ocean circulation driven by winds, evaporation and salinity also play a role in the reduction of CO2 associated with the onset of glaciation.
Finally, falling sea levels also impact the growth of coral reefs and other ocean ecosystems which affect the amount of CO2 stored in the ocean.
As Prof Richard Alley, professor of geosciences at Penn State University, tells Carbon Brief:
The effect of the orbital features on the total sunlight reaching the Earth is almost zero; the sunshine is just moved between areas and seasons. But, the whole world cools into an ice age, and the whole world warms coming out of an ice age, despite half the world getting less sun when the other half gets more. And, so far, all the explanations of this require the effects of the CO2, which beautifully explain it.
A recent study by Dr Daniel Baggenstos at the University of Bern and colleagues examined the relative contribution of different factors during the transition from the last ice age to the current interglacial period. They found that albedo – changing reflectivity of the surface as ice sheets shrink – was the largest factor responsible for about half of the warming, while changing CO2 concentrations and other greenhouse gases was responsible for 37%, while reductions of the amount of reflective dust and other aerosols in the atmosphere made up the remaining 13%.
Lags and leads
A lot of discussion online about the role of CO2 in ice ages – and associated arguments by those sceptical of climate change – has focused on the fact that CO2 lags behind temperatures during “deglaciation” at the end of ice ages.
In some ways, however, this is exactly what we would expect; there were no humans burning fossil fuels during the end of the last ice age, so CO2 served more as a feedback to orbital changes rather than the climate forcing that it is today.
As Alley tells Carbon Brief:
“There is no way for the orbits to directly change CO2 – a bit more sun in the northern summer melts ice, but doesn’t immediately cause CO2 to change. So, CO2 must be a feedback. Because the amount of sunshine – and the amount of ice – have direct and immediate effects on temperature, there should be places on Earth in which any change in CO2 lags rather than leads the orbital cause and the temperature change.
This should not bother anyone. It often does, but it shouldn’t. The analogy I sometimes use is that, if I overspend my credit card and go into debt, interest will kick in and make my debt bigger. The interest lags debt – first I go into debt, then I pay interest, then I go further into debt. Pretty much everyone understands that this is a sensible, if unpleasant situation. When the orbits affect ice and temperature, this changes other things that, in turn, affect CO2, which, in turn, affects temperature some more – similarly sensible if the full story is understood.”
That said, understanding of the interrelationship between CO2 and temperature at the end of ice ages has advanced in recent years with better reconstructions of both past temperature and CO2 levels in ice cores from Antarctica.
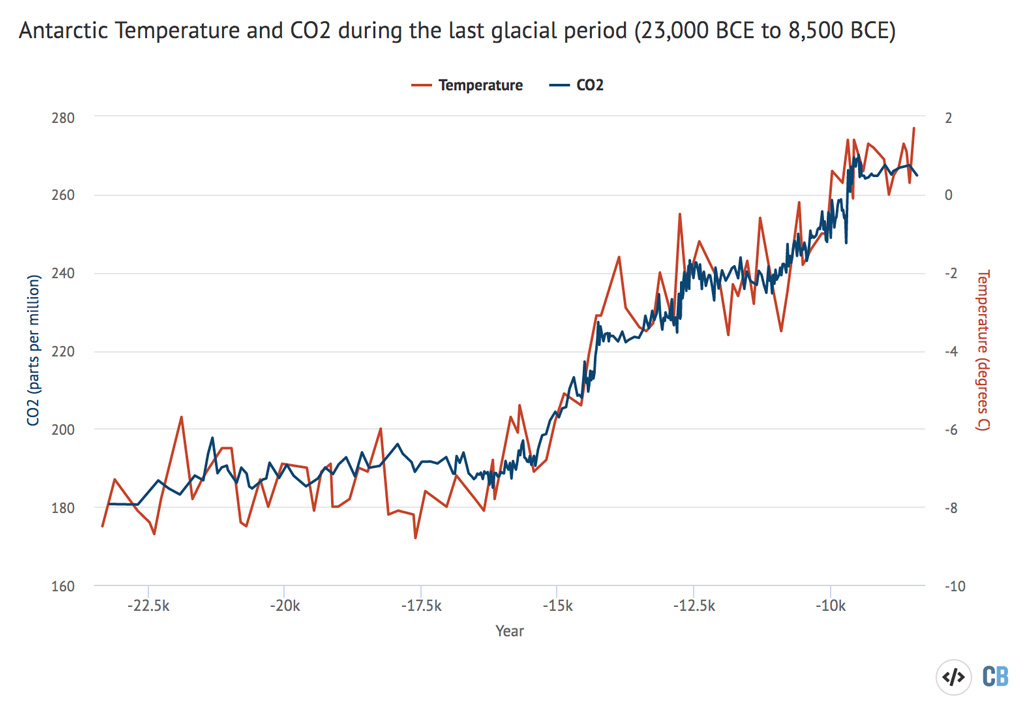
While scientists used to think that CO2 lagged temperatures by 600 to 1,000 years during deglaciation, a number of recent studies have suggested that the lag is considerably smaller or even too small to detect. It is challenging to precisely match up CO2 records and temperature records from ice cores as there is a delay between new snowfall on an ice sheet (that traps the air bubbles) and then that snow slowly compressing into ice.
The figure below shows Antarctic temperatures (red line) and CO2 from recent proxy reconstructions (blue line) during the end of the last ice age – from 23,000BC to 8,500BC. While some periods might experience lags of a few hundred years, the relationship appears much more tightly coupled than was suggested by earlier reconstructions with larger uncertainties.
In addition, looking at temperature data from Antarctica alone also obscures a more nuanced global picture.
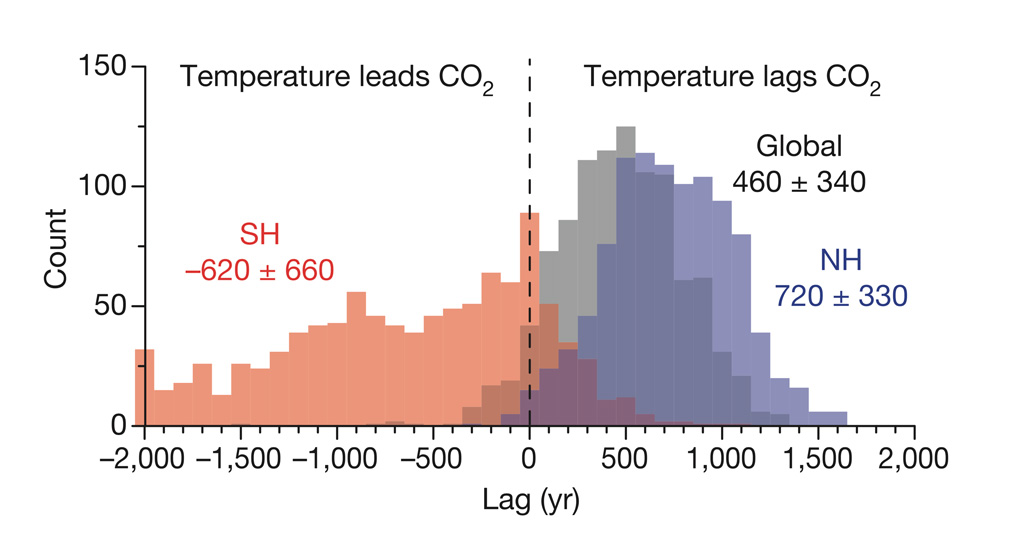
A 2013 paper by Dr Jeremy Shakun of Boston College and colleagues examined a network of 80 climate proxy records around the world during the end of the last ice age. They found that while CO2 generally lagged temperatures in the southern hemisphere – consistent with Antarctic reconstructions – the same was not true for the rest of the world.
Both the northern hemisphere and overall global temperatures actually lagged CO2; in other words, for the world as a whole, warming happened after atmospheric CO2 concentrations increased. The reasons for this are complex and are driven in part by changes in ocean currents as ice ages end.
The figure below shows the results from the Shakun et al 2013 paper for different regions of the world, along with the uncertainties in their estimate across different climate proxy locations and time periods during the end of the last ice age. The orange values are for the southern hemisphere, the blue values show the northern hemisphere and the grey values show global temperature estimates. The count on the y-axis represents how many of the 1,000 simulations – which examined the sensitivity of the results to uncertainties in CO2 age datingand proxy temperature estimates – show a lag of that size.
Specifically, Shakun and colleagues argue that changes in orbital cycles triggered initial melting of ice sheets in the northern hemisphere. This caused large amounts of freshwater to pour into the oceans as ice sheets melted, disrupting the Atlantic Meridional Overturning Circulation (AMOC), which, in turn, cooled the northern hemisphere and warmed the southern hemisphere.
This southern hemisphere warming caused ocean releases of CO2, which, in turn, warmed the entire planet. Shakun et al suggest that the vast majority of the global warming at the end of the last ice age occurred after CO2 increased, though this warming was driven by a combination of albedo (reflectivity) changes and the greenhouse effect.
What can we learn from glacial cycles
The world of the past ice age was very different from today. It is not necessarily assumed that all the same forces are at work today because human emissions now drive climate changes.
For example, the absence of large-scale sea ice cover in the Southern Ocean means that rising temperatures are not expected to drive ocean release of CO2 in the current climate – though the strength of the ocean CO2 sink is expected to decrease as the world continues to warm.
While there is a clear relationship between CO2 and temperature over the past million years, it is difficult to extrapolate to future changes to the Earth’s climate. For example, at the end of the last ice age atmospheric CO2 concentrations increased by around 50% while global temperatures increased by around 4C. If CO2 were the only factor at work, this would imply a very high sensitivity of the climate to CO2 – around 8C per doubling CO2, far higher than current estimates based on climate models and other lines of evidence.
However, if CO2 only contributed around 35% of the warming at the end of the last ice age – with changing albedo from melting ice sheets playing a major role – this would imply a climate sensitivity of around 3C – much more in-line with current model estimates, though with a very large uncertainty given the limits to how accurately models simulate global changes over that period.
At the same time, the fact that CO2 played such an important role in amplifying initial orbital changes during ice ages further reaffirms its role as the major control knob of the Earth’s climate.
The fact that relatively small changes in external forcings can drive such a large planetary response during ice ages should serve as a cautionary example. This is because human emissions of CO2 and other greenhouse gases push the Earth further out of the range of climate conditions that have characterised the past few million years.
Global temperatures were only around 4C colder during the last ice age than they are today. Under higher emissions scenarios with limited mitigation efforts, it is quite possible that the world may warm more in just over a century than it warmed over many thousands of years during the end of the last ice age.
-
Explainer: How the rise and fall of CO2 levels influenced the ice ages
-
Explainer: The influence of CO2 levels during the ice ages