‘Extreme’ El Niños to double in frequency under 1.5C of warming, study says
Robert McSweeney
07.24.17Robert McSweeney
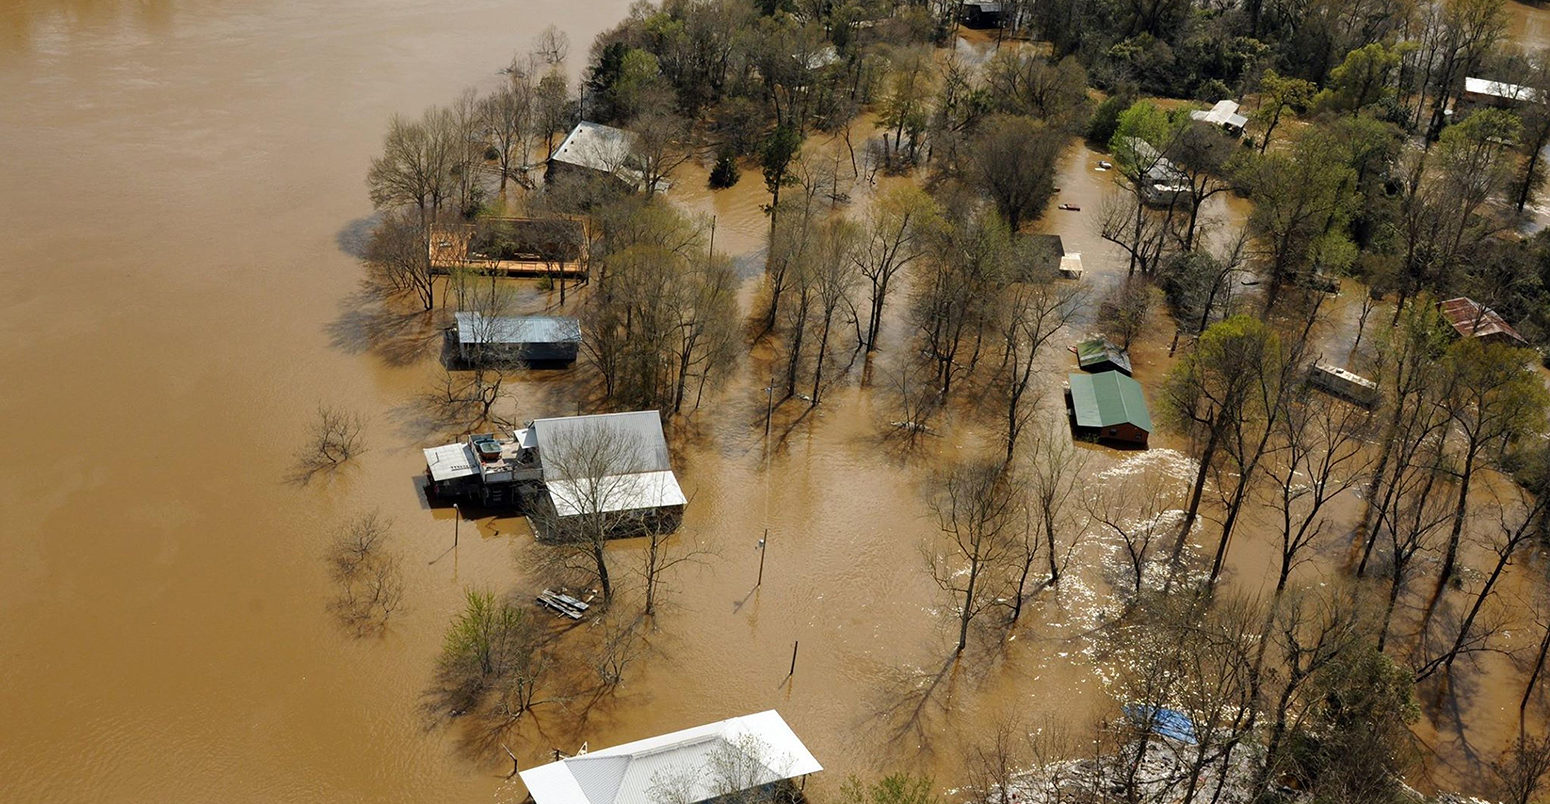
24.07.2017 | 4:00pmThe El Niño event of 2015-16 was one of the strongest on record, bringing flooding to much of South America, southern US and East Africa, and severe drought to Australia and southeast Asia.
Now a new study, published in Nature Climate Change, suggests that similar “extreme” El Niño events could become more frequent as global temperatures rise.
If global warming reaches 1.5C above pre-industrial levels – the aspirational limit of the Paris Agreement – extreme El Niño events could happen twice as often, the researchers find.
That means seeing an extreme El Niño on average every 10 years, rather every 20 years.
Extreme events
El Niño is a global weather phenomenon that originates in the Pacific Ocean. A weakening in the trade winds across the equatorial Pacific brings warm ocean temperatures to the eastern Pacific, off the coast of South America.
This has major impacts on rainfall patterns worldwide, explains study co-author Dr Wenju Cai from the Commonwealth Scientific and Industrial Research Organisation (CSIRO) in Australia. He tells Carbon Brief:
“These movements cause a massive reorganisation of the atmosphere circulation, leading to extreme climate and weathers around the globe. For example, floods in Ecuador, Peru and southwest American, but drought in Indonesia and other western Pacific countries.”
While we might see an El Niño event every five years or so, every decade or two an “extreme” event arrives. As well as the 2015-16 event, some of the strongest El Niños in recent history include 1982-83 and 1997-98.
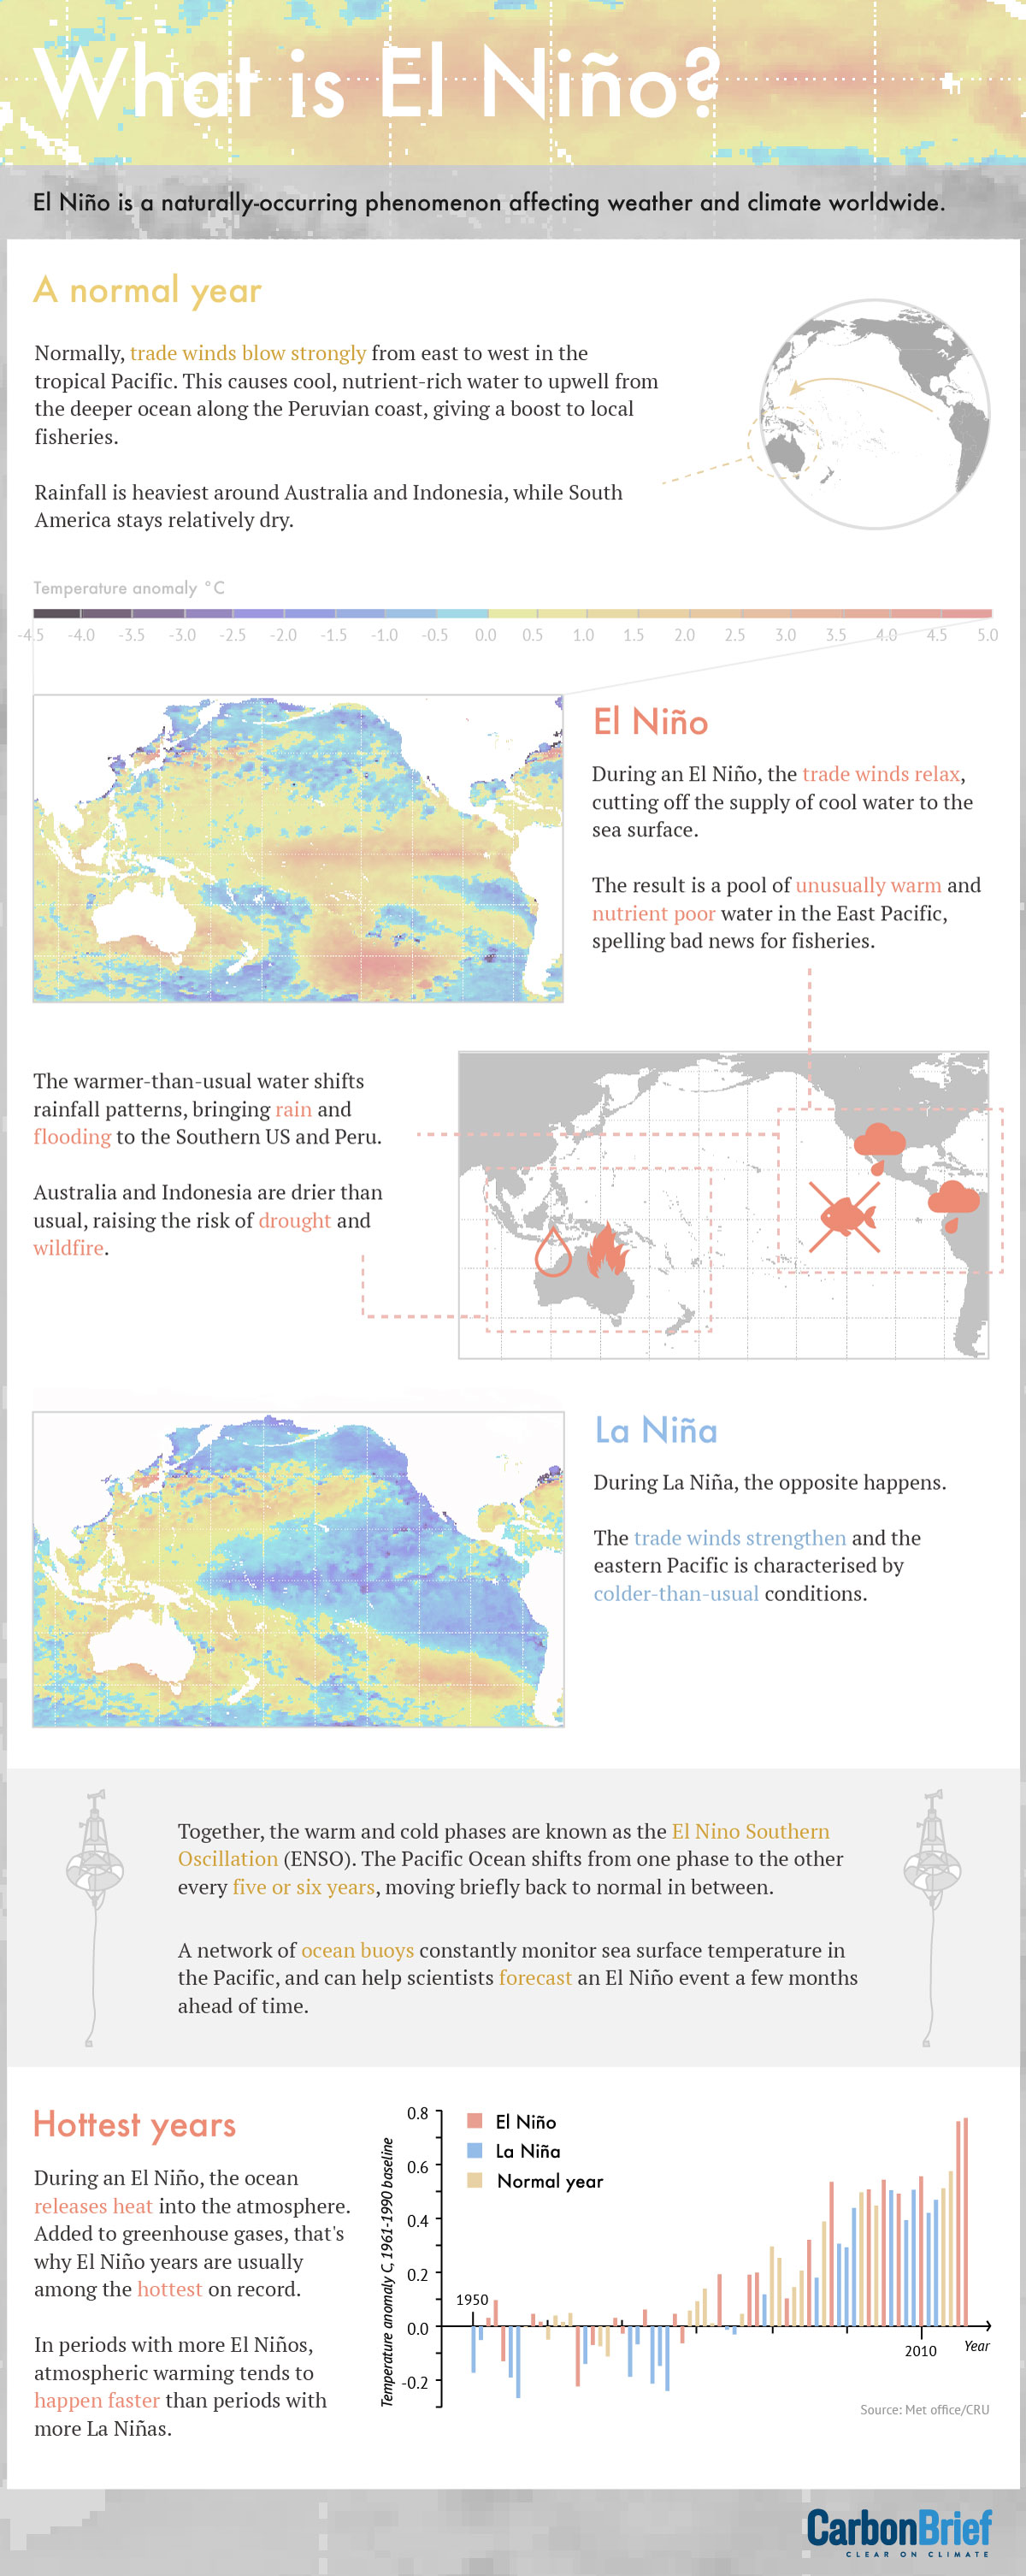
What is El Niño? Infographic by Rosamund Pearce for Carbon Brief.
In the new study, the researchers define an “extreme” event by the size of the rainfall shift from the west Pacific over to the normally dry east Pacific.
Using a collection of 13 climate models, the researchers simulated the frequency of extreme El Niño events from a pre-industrial period of 1869-99 to the end of the 21st century.
Their simulations assume global emissions follow the RCP2.6 pathway. This is a “peak and decline” scenario where stringent mitigation and negative emissions technologies mean atmospheric CO2 concentration peaks and then falls during this century.
The models suggest that an extreme El Niño event in pre-industrial times would occur perhaps once every 22 years. As global temperatures rise, the frequency of extreme El Niños in the models then increases at a similar pace.
You can see this in the left-hand chart below, which shows global temperature rise (black line; left-hand axis) and the frequency of extreme El Niño events (purple line; right-hand axis). The two lines track closely together.
By the time warming reaches 1.5C above pre-industrial levels (see the green shaded strip), extreme El Niños occur about once every 10 years. That’s an increase of 130% over the pre-industrial frequency, the paper notes.
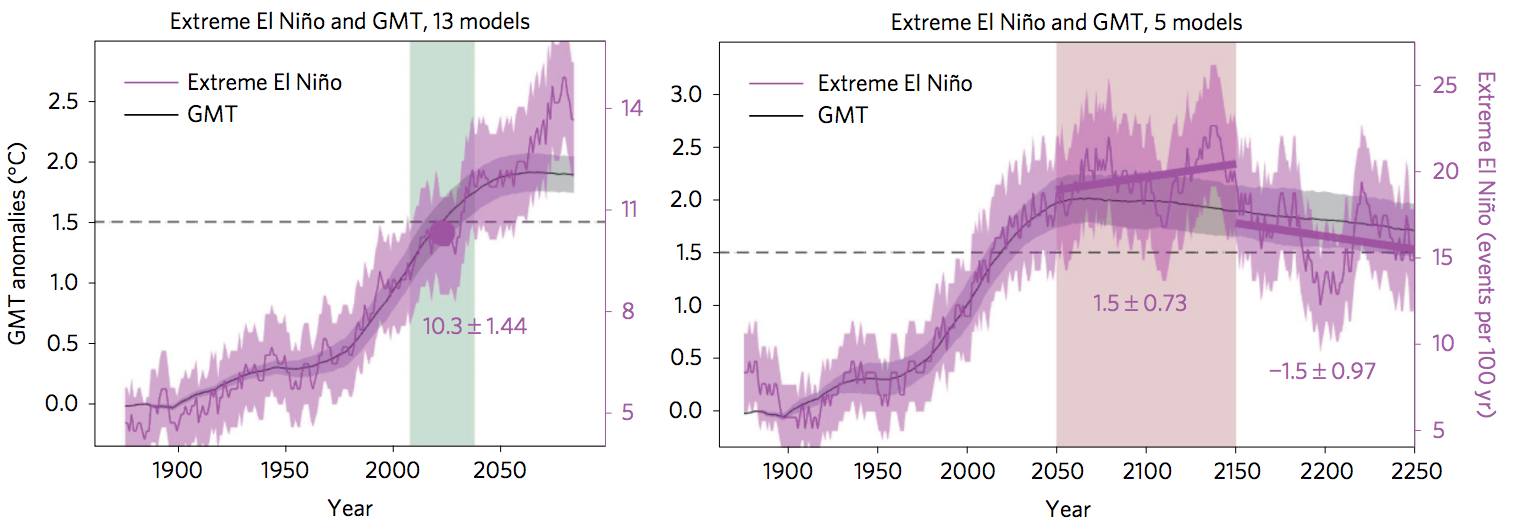
Charts show number of extreme El Niños per 100 years (purple line, right-hand axis) plotted against global average temperature (black line, left-hand axis, against a pre-industrial baseline of 1869-1899). Charts show projections to the end of the 21st century (left) and then out to the mid-23rd century (right). Green shaded area indicates the average over the 31 years centred at 1.5C of warming; purple shaded area indicates average of 2050-2150. Source: Wang, G. et al. (2017).
Uneven warming
Using a subset of five models, the researchers continued their simulations out to the middle of the 23rd century. They find that even after the temperature rise levels off, the frequency of extreme El Niño events keeps increasing.
You can see this in the right-hand chart above. As global temperatures (black line) decrease slowly after 2050, the frequency of extreme El Niño events (purple line) continues to rise. Beyond 2050, events increase to about one event every seven years, the paper says, eventually peaking at an event every five years by the early 22nd century.
This was an unexpected result, says Cai:
“Surprisingly, the frequency of extreme El Niño continues to increase for another century and by at least 40% after global mean temperature stabilises.”
It’s not until around 2150 that the frequency of extreme events starts to drop again.
This happens because the way that the Earth warms up is not uniform, says Cai, which makes it easier for the Pacific to switch into an El Niño state:
“Warming in the eastern equatorial Pacific is greater than the surrounding regions…making it easy to move convection and [the tropical] rainband to the eastern equatorial Pacific. After global mean temperatures stabilise, the faster warming in the eastern equatorial Pacific persists.”
La Niña
The study also analysed potential future changes in extreme events of El Niño’s cold water counterpart, La Niña.
During La Niña events the trade winds strengthen and the central and eastern Pacific Ocean becomes even colder than normal. La Niñas are known to bring drought to the southwestern US, floods to Central America and hurricanes to the Atlantic Ocean.
A previous study by many of the same authors found that if global carbon emissions aren’t curbed, extreme La Niña events could become more frequent in the 21st century – up from once every 23 years to once every 13 years.
However, the new study suggests that more frequent extreme La Niña events will be avoided if global temperature rise is limited to 1.5C or 2C.
Overall, the research “provides another example of why defining ‘dangerous’ climate change in terms of global mean temperature targets does not give the full picture”, says Prof Mat Collins, joint Met Office chair in climate change at the University of Exeter, who wasn’t involved in the study. In other words, the impacts of climate change are much more complicated than just how global average temperatures change.
But to be fully confident in the study’s findings, scientists need to overcome some issues with how models simulate ocean temperatures in tropical regions of the Pacific, says Collins:
“I still worry about problems with models in the tropical Pacific, whereby they tend to produce sea surface temperatures that are too cold in the present day. Ultimately, we need to significantly improve models and reduce systematic biases in order to test the robustness of results like this.”
Wang, G. (2017) Continued increase of extreme El Niño frequency long after 1.5C warming stabilization, Nature Climate Change, doi:10.1038/nclimate3351
-
‘Extreme’ El Niños to double in frequency under 1.5C of warming, study says
-
El Niño events could become more frequent as global temperatures rise