
Factcheck: Mail on Sunday’s ‘astonishing evidence’ about global temperature rise
Zeke Hausfather
02.05.17Zeke Hausfather
05.02.2017 | 4:38amThis is a guest post by Zeke Hausfather, a climate scientist and energy systems analyst at Berkeley Earth, an independent temperature analysis project.
In an article in today’s Mail on Sunday, David Rose makes the extraordinary claim that “world leaders were duped into investing billions over manipulated global warming data”, accusing the US National Oceanic and Atmospheric Administration (NOAA) of manipulating the data to show more warming in a 2015 study by Tom Karl and coauthors.
What he fails to mention is that the new NOAA results have been validated by independent data from satellites, buoys and Argo floats and that many other independent groups, including Berkeley Earth and the UK’s Met Office Hadley Centre, get effectively the same results.
NOAA’s results are independently verified
The new NOAA record published in Karl et al primarily updated their ocean temperature record. While they also released a revised land record based on data from the International Surface Temperature Initiative (and the related Global Historical Climatology Network version 4 beta product – GHCNv4), the land record was largely similar to their prior record and was responsible for relatively little of the increase in warming they showed.
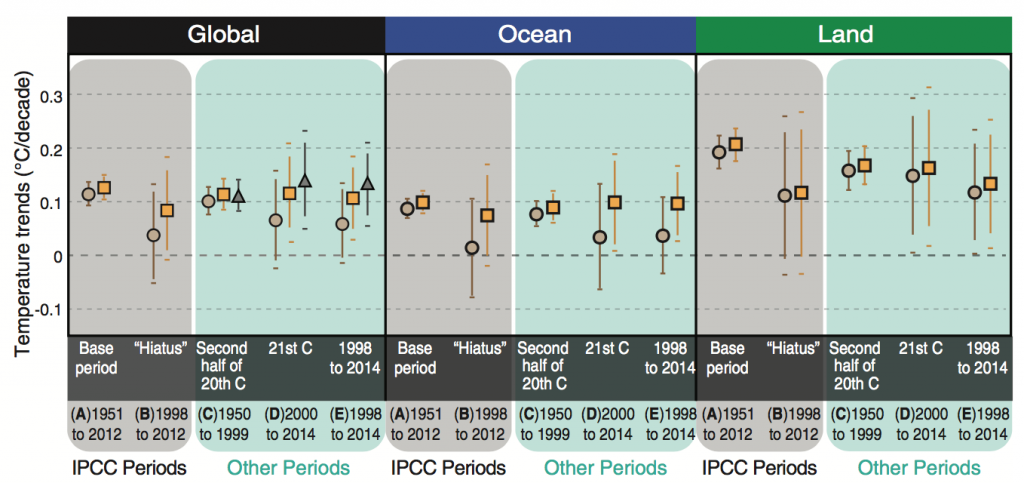
Figure 1 from Karl et al 2015. Almost all of the difference between the trends in the new and old temperature records were due to updates to ocean temperatures.
I recently led a team of researchers that evaluated NOAA’s updates to their ocean temperature record. In a paper published last month in the journal Science Advances, we compared the old NOAA record and the new NOAA record to independent instrumentally homogenous records created from buoys, satellite radiometers, and Argo floats. Our results, as you can see in the chart below, show that the new NOAA record agrees quite well with all of these, while the old NOAA record shows much less warming.
This was due to two factors: the old NOAA record spliced together warmer ship data with colder buoy data without accounting for the offset between the two; and the new NOAA record puts more weight on higher-quality buoy records and less weight on ship records (versus the old NOAA record which treated ships and buoys equally). You can read more about the study in Carbon Brief’s article.
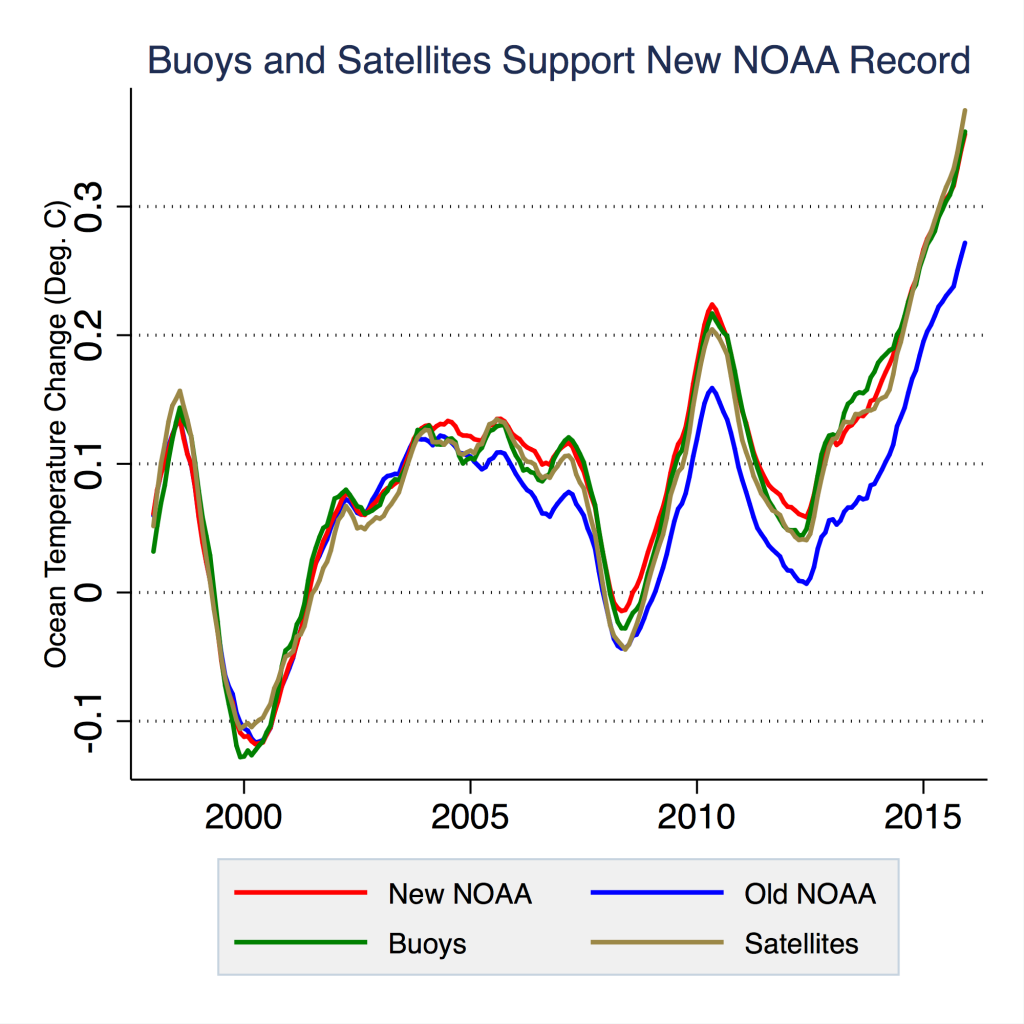
Global sea surface temperatures from the old NOAA record (ERSSTv3b), the new NOAA record (ERSSTv4), and instrumentally homogenous records from buoys and satellites. See Hausfather et al 2017 for details, as well as comparisons with shorter Argo-based records.
The fact that the new NOAA record is effectively identical with records constructed only from higher quality instruments (buoys, satellite radiometers, and Argo floats) strongly suggests that NOAA got it right and that we have been underestimating ocean warming in recent years.
John Kennedy, a researcher at the UK’s Met Office in charge of their ocean temperature product, agrees that NOAA’s new record is probably the most accurate in the last two decades, remarking: “At a global scale, those adjustments really do seem to work and the ERSSTv4 adjustments [NOAA’s new record] work best of all.”
Rose’s claim that NOAA’s results “can never be verified” is patently incorrect, as we just published a paper independently verifying the most important part of NOAA’s results.
NOAA’s land data similar to other records
The land record that NOAA used in the Karl et al paper was a sneak peak at their new GHCNv4, which increases the number of global land stations from the 4,400 currently used to around 25,000.
This is quite similar to the Berkeley Earth land temperature record, which uses a similar number of stations. There is little reason to think that the inclusion of more station data will give us less accurate results.
The Karl et al land record ends up quite similar to the old one, though it shows about 5% more warming since 1970, mostly attributable to the inclusion of additional stations in the Arctic. As the chart below demonstrates, their results are quite similar to those of Berkeley Earth as well as the current operational NOAA land record (based on GHCN version 3), and also agree quite well with the latest version of GHCNv4.
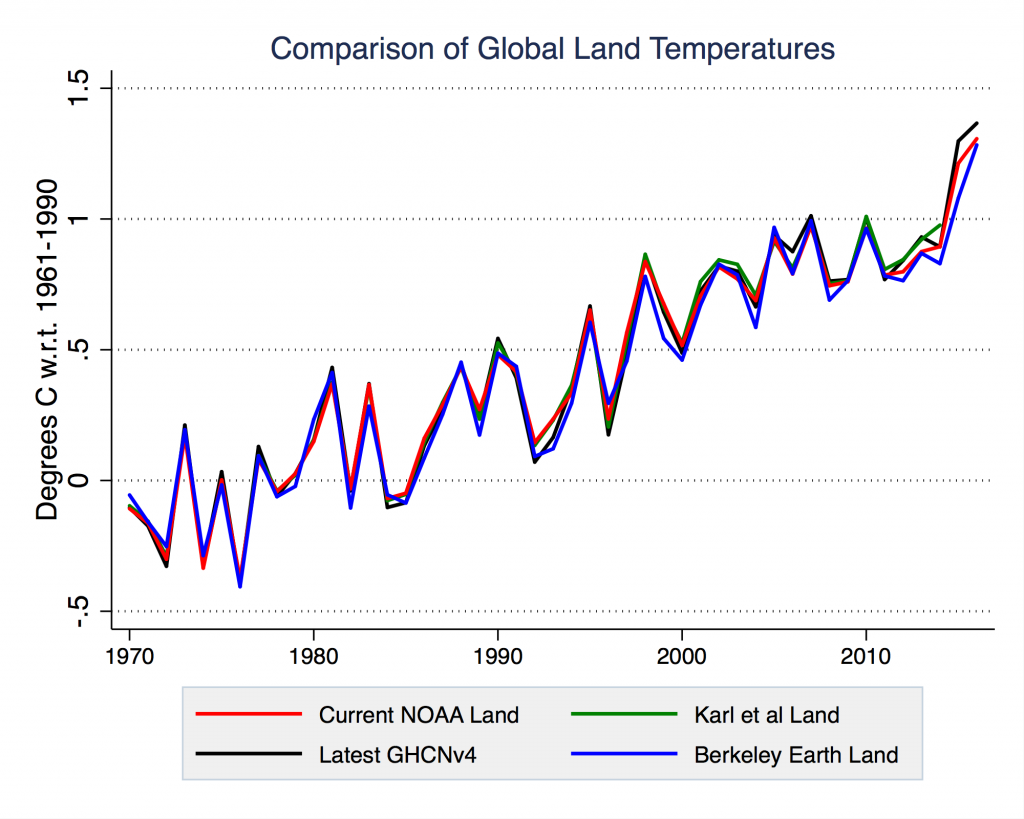
Global land temperature records including the current official NOAA land temperature record (based on GHCNv3), the Karl et al land record, a land record based on the latest GHCNv4 data, and the Berkeley Earth land record.
The new NOAA temperature record is also by no means an outlier when compared to other groups producing global (land and ocean) surface temperature records. It shows less warming in recent years than records from Berkeley Earth, NASA, and Cowtan and Way, and a bit more warming than found in the Hadley Centre/CRU record. The old NOAA record, on the other hand, was on the bottom of the pack, with less warming than found by the other groups.
If folks don’t like the NOAA data, they will get the exact same story using surface temperature data from any other group, with no detectable sign of a “hiatus” or “pause” through to the present.
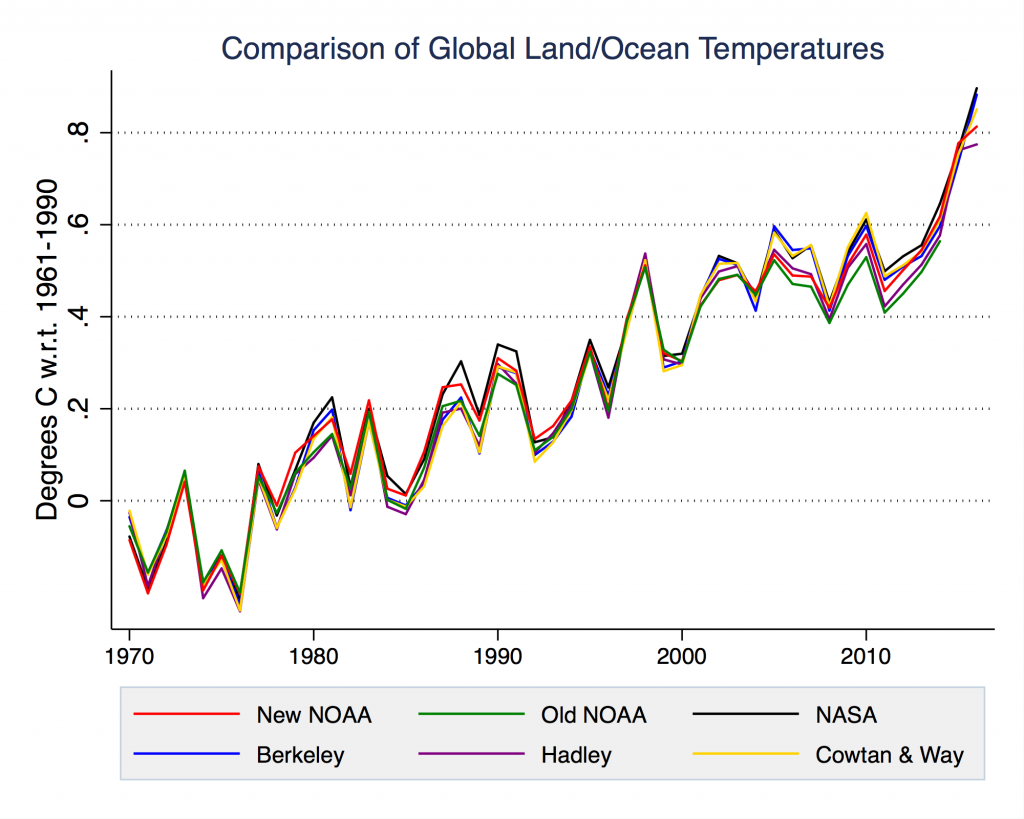
Global land/ocean temperature records from NOAA, NASA, Berkeley Earth, Hadley/UAE, and Cowtan and Way. Note that the old (pre-Karl et al) NOAA temperature record is only available through the end of 2014.
NOAA did make their data available
In his article, David Rose relies on reports from a researcher at NOAA who was unhappy about the data archiving associated with the Karl et al paper. While I cannot speak to how well the authors followed internal protocols, they did release their temperature anomalies, spatially gridded data land and ocean data, and the land station data associated with their analysis. They put all of this up on NOAA’s FTP site in early June 2015, at the time that the Karl et al paper was published.
As someone who works on and develops surface temperature records, the data they provided would be sufficient for me to examine their analysis in detail and see how it compared to other groups. In fact, I used the data they provided shortly after the paper was published to do just that. While it would have been nice for them to publish their full analysis code online as well as the data, I’m sure they would have provided it to any researchers who asked.
Rose also makes a big deal about the fact that NOAA’s new ocean temperature product adjusts buoys up to match ship data versus adjusting ship data down to match buoys. This turns out to be a bit of a red herring; since scientists are interested in the change in temperatures over time, you end up with the same increase in temperatures (e.g, the temperature trend) if you apply the offset to one or the other.
Because climate scientists work with temperature anomalies (rather than absolutes), the direction of the offset doesn’t have any effect on the resulting temperature series. On the other hand, not correcting for the offset between ships and buoys results in a spurious cooling bias, and a record that differs a lot from the buoys themselves as we found in our paper.
Rose’s article presents a deeply misleading graph where he shows an arbitrary offset between NOAA’s data and the Hadley land/ocean dataset. This is an artefact of the use of different baselines; Hadley’s “0C” value is relative to the average temperature from 1961-1990, while NOAA’s is relative to the average temperature from 1901-2000 (a period which includes the colder early 20th century).
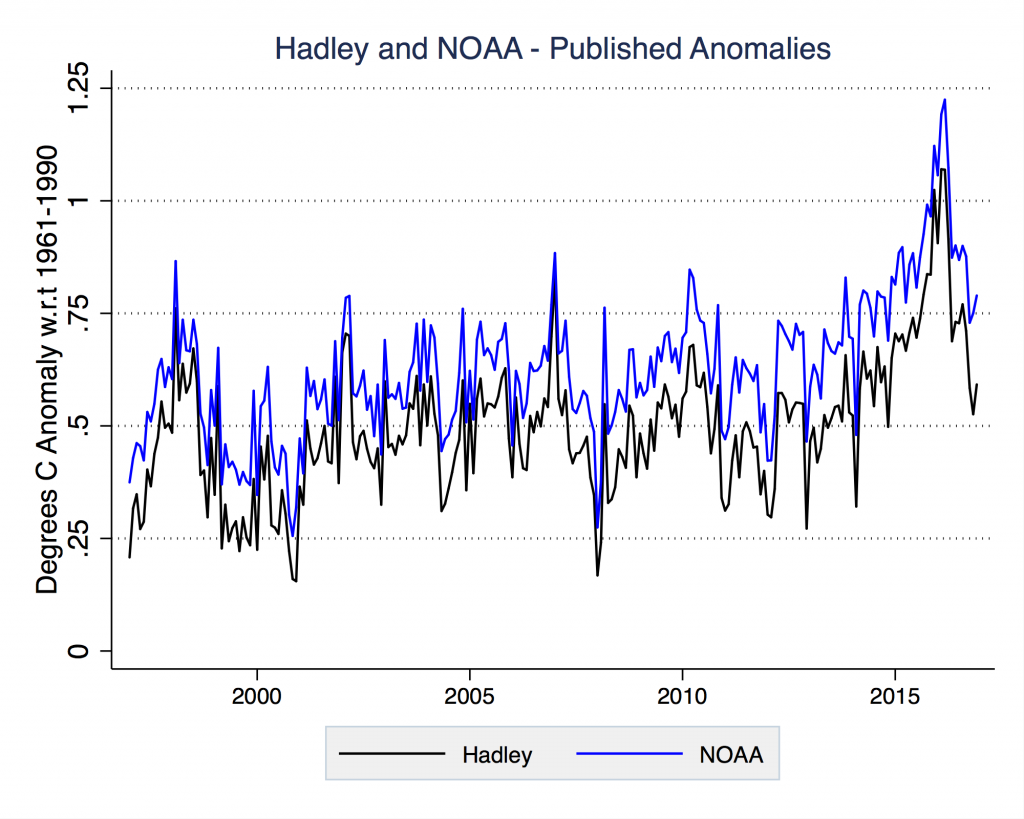
Comparison of published HadCRUT4 and NOAA global land/ocean monthly temperature anomalies.
This comparison ends up being spurious, because each record uses a different baseline period to define their temperature anomaly. As the chart below shows, when you correctly put the two datasets on the same baseline (eg, with respect to the 1961-1990 period), you find no offset in recent years between the two, though there is slightly more warming in the NOAA dataset due to the higher weight they give more reliable buoy data in their analysis.
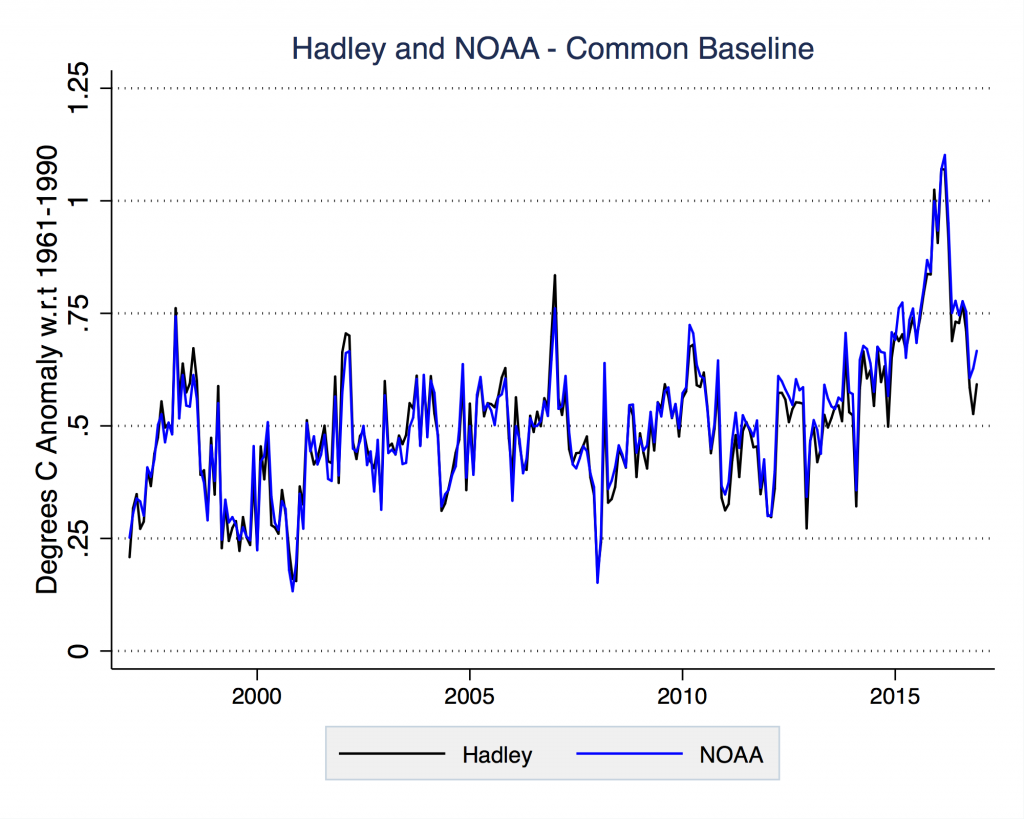
Comparison of HadCRUT4 and NOAA global land/ocean monthly temperature anomalies put on a common 1961-1990 baseline.
Similarly, if you simply download the NOAA and Hadley ocean temperature datasets you would find that the published Hadley values are actually higher than the published NOAA ocean values in recent years. This is because Hadley uses a 1961-1990 baseline for their ocean temperature product while NOAA uses a 1971-2000 baseline. Putting both datasets on a common baseline is essential to performing accurate comparisons.
Further updates to come from NOAA
NOAA is planning on further updates to their sea surface temperature record this year to incorporate Argo data and to make some adjustments to their spatial interpolation technique. Based on the preliminary results that their team presented at the American Geophysical Union meeting late last year, their new record (ERSSTv5) will have about 10% less warming than their current record (ERSSTv4) over the 2000-2015 period, largely due to changes in the way that they account for areas with limited data. Their upcoming record will still show 50% more warming than the old NOAA record (ERSSTv3b).
While NOAA’s data management procedures may well need improvement, their results have been independently validated and agree with separate global temperature records created by other groups.
The “astonishing evidence” that David Rose purports to reveal in no way changes our understanding of modern warming or our best estimates of recent rates of warming. It does not in any way change the evidence that policymakers have at their disposal when deciding how to address the threats posed by climate change.
If anything, there is strong independent evidence that NOAA’s new record may be the most accurate one over the last two decades, at least for the two-thirds of the world covered in ocean.
-
Factcheck: Mail on Sunday’s ‘astonishing evidence’ about global temperature rise