
Factcheck: What is the carbon footprint of streaming video on Netflix?

George Kamiya
02.25.20George Kamiya
25.02.2020 | 1:08pmThe use of streaming video is growing exponentially around the world. These services are associated with energy use and carbon emissions from devices, network infrastructure and data centres.
Yet, contrary to a slew of recent misleading media coverage, the climate impacts of streaming video remain relatively modest, particularly compared to other activities and sectors.
Drawing on analysis at the International Energy Agency (IEA) and other credible sources, we expose the flawed assumptions in one widely reported estimate of the emissions from watching 30 minutes of Netflix. These exaggerate the actual climate impact by up to 90-times.
The relatively low climate impact of streaming video today is thanks to rapid improvements in the energy efficiency of data centres, networks and devices. But slowing efficiency gains, rebound effects and new demands from emerging technologies, including artificial intelligence (AI) and blockchain, raise increasing concerns about the overall environmental impacts of the sector over the coming decades.
Update 25/11/2020: The energy intensity figures for data centres and data transmission networks have been updated to reflect more recent data and research. As a result, the central IEA estimate for one hour of streaming video in 2019 is now 36gCO2, down from 82gCO2 in the original analysis published in February 2020. The updated charts and comparisons also include the corrected values published by The Shift Project in June 2020, as well as other recent estimates quoted by the media.
Misleading media
A number of recent media articles, including in the New York Post, CBC, Yahoo, DW, Gizmodo, Phys.org and BigThink, have repeated a claim that “the emissions generated by watching 30 minutes of Netflix [1.6 kg of CO2] is the same as driving almost 4 miles”.
The figures come from a July 2019 report by the Shift Project, a French thinktank, on the “unsustainable and growing impact” of online video. The report said streaming was responsible for more than 300m tonnes of CO2 (MtCO2) in 2018, equivalent to emissions from France. The Shift Project published a follow-up article in June 2020 to correct a bit/byte conversion error, revising the original “1.6kg per half hour” quote downwards by 8-fold to 0.2kg per half hour.
The Shift Project’s original “3.2kgCO2 per hour” estimate is around eight times higher than a 2014 peer-reviewed study on the energy and emissions impacts of streaming video, while their “corrected” estimate of 0.4kgCO2 per hour is similar to the 2014 peer-reviewed study.
That 2014 study found streaming in the US in 2011 emitted 0.42kgCO2e per hour on a lifecycle basis, including “embodied” emissions from manufacture and disposal of infrastructure and devices. Emissions from operations – comparable in scope to the Shift Project analysis – accounted for only 0.36kgCO2e per hour.
However, because the energy efficiency of data centres and networks is improving rapidly – doubling every couple of years – energy use and emissions from streaming today should be substantially lower.
Looking at electricity consumption alone, the original Shift Project figures imply that one hour of Netflix consumes 6.1 kilowatt hours (kWh) of electricity. This is enough to drive a Tesla Model S more than 30km, power an LED lightbulb constantly for a month, or boil a kettle once a day for nearly three months. The corrected figures imply that one hour of Netflix consumes 0.8 kWh.
With 167 million Netflix subscribers watching an average of two hours per day, the corrected Shift Project figures imply that Netflix streaming consumes around 94 terawatt hours (TWh) per year, which is 200-times larger than figures reported by Netflix (0.45TWh in 2019).
Another recent claim on Channel 4 Dispatches estimated that 7bn YouTube views of a 2017 hit song – “Despacito”, by Luis Fonsi and Daddy Yankee, featuring Justin Beiber – had consumed 900 gigawatt hours (GWh) of electricity, or 1.66 kWh per viewing hour. At this rate, YouTube – with more than one billion viewing hours a day – would consume more than 600 TWh a year (2.5% of global electricity use), which would be more than the electricity used globally by all data centres (~200 TWh) and data transmission networks (~250 TWh).
It is clear that these figures are too high – but by how much?
Flawed assumptions
The assumptions behind the Shift Project analysis (largely based on a 2015 paper, whose assumptions have been significantly revised in 2019 and 2020) contain a series of flaws, which, taken together, seriously exaggerate the electricity consumed by streaming video.
The original “1.6kg per half hour” claim overestimated bitrate, the amount of data transferred each second during streaming, apparently assuming a figure of 24 megabits per second (Mbps), equivalent to 10.8 gigabytes (GB) per hour. This was six times higher than the global average bitrate for Netflix in 2019 (around 4.1 Mbps or 1.9 GB/hr, excluding cellular networks) and more than triple the transfer rate of high-definition (HD, 3 GB/hr). Other typical transfer rates are 7 GB/hr for ultra-high definition (UHD/4K), 0.7 GB/hr for standard definition (SD), and 0.25 GB/hr for mobile.
This difference stemmed from a stated assumption of 3Mbps apparently being converted in error to 3 megabytes per second, MBps, with each byte equivalent to eight bits. The Shift Project corrected this error in its June 2020 update, but did not revise any of its other assumptions, discussed below.
The chart below shows each of three ways that the Shift Project overestimated electricity use for streaming video – such as the bitrate – and one area where it underestimated the actual figure. These other errors are described in the text below the chart.
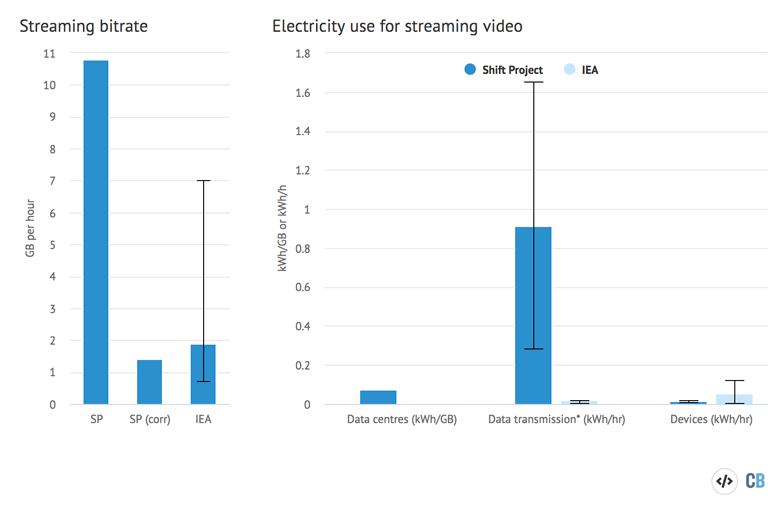
Estimates of data and electricity use for streaming video from the Shift Project (SP) and this analysis. Left chart: bitrate, in GB per hour. Right chart: electricity use in data centres (kWh/GB), data transmission networks (kWh per viewing hour) and devices used for viewing (kWh per viewing hour). *For data transmission networks, the Shift Project values (in kWh/GB) were converted to kWh per viewing hour based on their assumed bitrate of 3Mbps (1.35 GB/hr), for purposes of comparison with the revised IEA values. Source: the Shift Project and IEA analysis. Chart by Carbon Brief using Highcharts.
Second, the Shift Project analysis overestimates the energy intensity of data centres and content delivery networks (CDN) that serve streaming video to consumers by around 35-fold, relative to figures derived from 2019 Netflix electricity consumption data and subscriber usage data.
Third, my updated analysis shows the Shift Project overestimates the energy intensity of data transmission networks by around 50-fold, based on average bitrates for streaming video. This is the result of using high and outdated energy-use assumptions for various access modes – for example, 0.9 kWh/GB for “mobile” compared to more recent peer-reviewed estimates of 0.1-0.2 kWh/GB for 4G mobile in 2019.
My original February 2020 analysis showed that the Shift Project assumptions for data transmission energy intensity (0.15-0.88 kWh/GB) were much higher than more recent estimates (0.025-0.23kWh/GB). However, the latest research shows that these data-based intensity values (kWh/GB) are not appropriate for estimating the network energy use of high bitrate applications, such as streaming video. Instead, experts advise using time-based energy intensity values (kWh per viewing hour). Therefore, my assumptions for data transmission energy use have been updated with time-based energy intensity values.
However, the Shift Project underestimates the energy consumption of devices by around 4-fold, because it assumes that viewing occurs only on smartphones (50%) and laptops (50%). According to Netflix, however, 70% of viewing occurs on TVs, which are much more energy-intensive than laptops (15% of viewing), tablets (10%), and smartphones (5%).
Taken together, my updated analysis suggests that streaming a Netflix video in 2019 typically consumed around 0.077kWh of electricity per hour, some 80-times less than the original estimate by the Shift Project (6.1 kWh) and 10-times less than the corrected estimate (0.78kWh), as shown in the chart, below left. The results are highly sensitive to the choice of viewing device, type of network connection and resolution, as shown in the chart, below right.
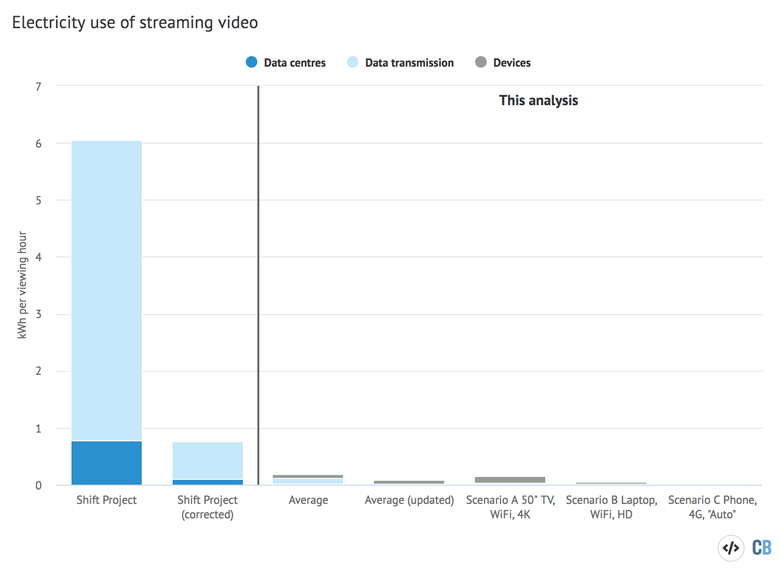
Average electricity use per hour of streaming video (kWh) according to the Shift Project (leftmost and second left bar) and this article’s analysis (third and fourth bars). A series of scenarios for viewing device, network connection and video resolution are also shown on the right. For the phone scenario, “automatic” data settings from Netflix are assumed. Source: the Shift Project and IEA analysis. Chart by Carbon Brief using Highcharts.
For example, a 50-inch LED television consumes much more electricity than a smartphone (100 times) or laptop (5 times). Because phones are extremely energy efficient, data transmission accounts for more than 80% of the electricity consumption when streaming.
Based on average viewing habits, my updated analysis shows that viewing devices account for the majority of energy use (72%), followed by data transmission (23%) and data centres (5%). In contrast, the Shift Project values show that devices account for less than 2% of total energy use, as a result of underestimating the energy use of devices (4x) while substantially overestimating the energy use of data centres (35x) and data transmission (50x).
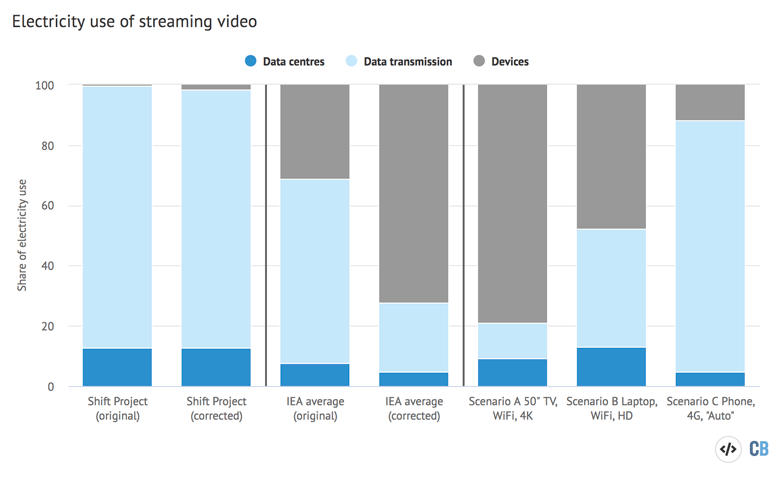
Share of electricity use by segment for streaming video according to the Shift Project (leftmost and second left bar) and this article’s analysis (third and fourth left bar). A series of scenarios for viewing device, network connection and video resolution are also shown on the right. Source: the Shift Project and IEA analysis. Chart by Carbon Brief using Highcharts.
Modest footprint
The carbon footprint of streaming video depends first on the electricity usage, set out above, and then on the CO2 emissions associated with each unit of electricity generation.
As with other electricity end-uses, such as electric vehicles, this means that the overall footprint of streaming video depends most heavily on how the electricity is generated.
Powered by the global average electricity mix, streaming a 30-minute show on Netflix in 2019 released around 0.018kgCO2e (18 grammes, fourth column in the chart, below). This is around 90-times less than the original 1.6kg figure from the Shift Project (leftmost column) and 11-times less than the “corrected” figure of 0.2kg (second column). The IEA estimate is also substantially lower than other estimates quoted in the media, including 22-times lower than the Despacito claim (cited on Channel 4, the BBC, Fortune and Al Jazeera, assuming a global average grid mix) and 11-times lower than the claim by Save On Energy that 80 million views of Birdbox emitted 66ktCO2 (cited in the New Yorker, Euronews, Forbes, Die Welt and the Daily Mail). My estimate of 36gCO2 per hour is more than 2,100-times lower than Marks et al. (2020) who estimated that 35 hours of HD video emits 2.68tCO2, or 77kgCO2 per hour.
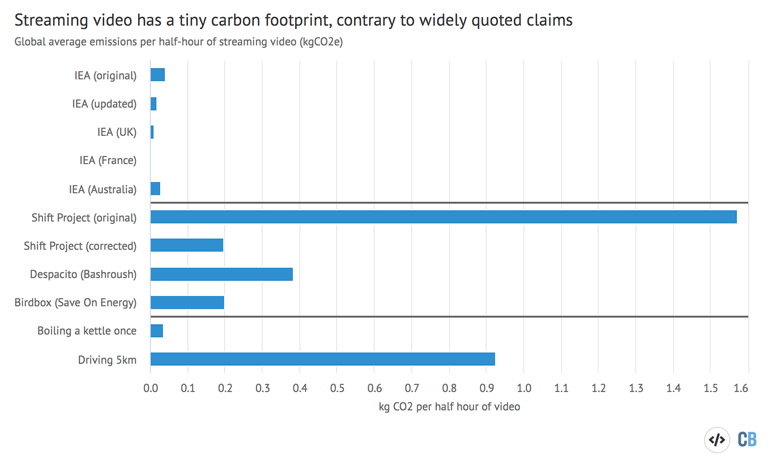
Global average carbon emissions per half-hour of streaming video (kgCO2e) according to this article’s analysis (topmost bar and second bar) and examples of country-level electricity systems. The Shift Project’s estimates and other recent claims quoted in the media are also included (middle), along with other activities for context (bottom). Source: the Shift Project and IEA analysis. Source: the Shift Project and IEA analysis. Chart by Carbon Brief using Highcharts.
To put it in context, my updated estimate for the average carbon footprint of a half-hour Netflix show is equivalent to driving around 100 metres in a conventional car.
But as the chart above shows, this figure depends heavily on the generation mix of the country in question. In France, where around 90% of electricity comes from low-carbon sources, the emissions would be around 2gCO2e, equivalent to 10 metres of driving.
Using country average emission factors may still overestimate emissions, particularly from data centres. Technology firms operating large data centres are leaders in corporate procurement of clean energy, accounting for about half of renewable power purchase agreements in recent years.
The electricity mix is also rapidly decarbonising in many parts of the world. For instance, the emissions intensity of electricity in the UK fell by nearly 60% between 2008 and 2018. Compared to 2019 levels, global emissions intensity of electricity falls by around a quarter by 2030 in the IEA Stated Policies Scenario and by half in the Sustainable Development Scenario.
Digital efficiency
Although the carbon footprint of streaming video remains relatively modest, it might still seem reasonable to expect the overall impact to rise, given exponential increases in usage.
However, there have already been major improvements in the efficiency of computing, described by “Koomey’s Law”. This law describes trends in the energy efficiency of computing, which has doubled roughly every 1.6 years since the 1940s – and every 2.7 years since 2000. A similar trend has been observed in data transmission networks, with energy intensity halving every two years since 2000.
Coupled with the short lifespans of devices and equipment, which hastens turnover, the efficiency of the overall stock of devices, data centres and networks is improving rapidly.
For example, increasingly efficient IT hardware (following Koomey’s Law) and a major shift to “hyperscale” data centres have helped to keep electricity demand flat since 2015 (chart, below right). Data centres worldwide today consume around 1% of global electricity use, even while internet traffic has tripled since 2015 and data centre “workloads” – a measure of service demand – have more than doubled (chart, below left).
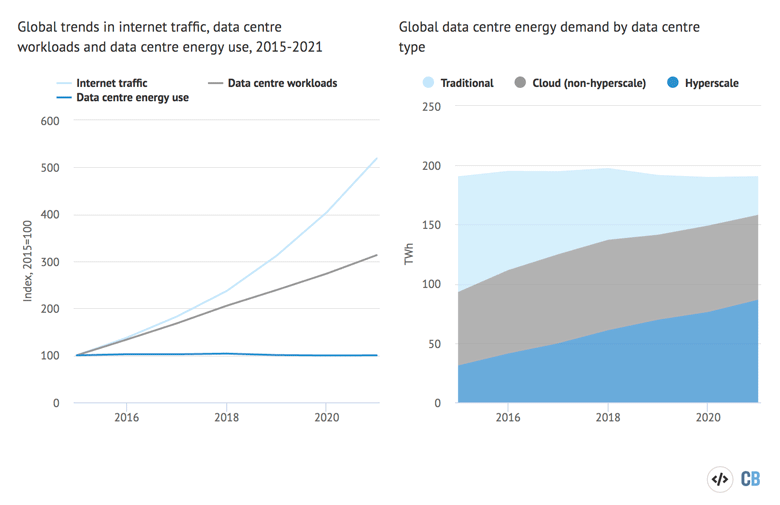
Left: Trends in internet traffic, data centre “workloads” and data centre energy use, 2015-2021, relative to 2015=100. Right: Global data centre energy demand by data centre type (terawatt hours). Source: IEA. Chart by Carbon Brief using Highcharts.
As well as changes that are invisible to the consumer, there are also obvious trends in the technology seen everyday. Devices are also becoming smaller and more efficient, for example, in shifts from CRT to LCD screens, and from personal computers to tablets and smartphones.
Rising demand
Set against all this is the fact that consumption of streaming media is growing rapidly. Netflix subscriptions grew 20% last year to 167m, while electricity consumption rose 84%.
Many new video streaming and cloud gaming services have also launched in recent months. Particularly noteworthy is the rapid growth in video traffic over mobile networks, which is growing at 55% per year. Phones and tablets already account for more than 70% of the billion hours of YouTube streamed every day.
The ease of accessing streaming media is leading to a large rebound effect, with overall streaming video consumption rising rapidly. But the complexity of direct and indirect effects of digital services, such as streaming video, e-books, and online shopping, make it immensely challenging to quantify the net environmental impacts, relative to alternative forms of consumption.
Moreover, emerging digital technologies, such as machine learning, blockchain, 5G, and virtual reality, are likely to further accelerate demand for data centre and network services. Researchers have started to study the potential energy and emissions impacts of these technologies, including blockchain and machine learning.
It is becoming increasingly likely that efficiency gains of current technologies may be unable to keep pace with this growing data demand. To reduce the risk of rising energy use and emissions, investments in RD&D for efficient next-generation computing and communications technologies are needed, alongside continued efforts to decarbonise the electricity supply.
Broader context
Streaming video is a fairly low-emitting activity, especially compared to driving to a cinema, for instance. As consumers, we can further reduce our environmental footprint by using smaller devices and screens, which consume less electricity. Replacing devices less often can also help, since the production phase accounts for around 80% of the lifecycle carbon emissions of mobile devices (and about a third for televisions), and electronic waste is a growing problem across the world.
Much less data-intensive digital activities, such as email, have also drawn significant and misleading media attention regarding their carbon footprint. Recent headlines in the Financial Times, the Guardian and Bloomberg Green have suggested that cutting back on e-mails could lead to substantial emission reductions – more than 16,000 tonnes per year in the UK, if every adult sent one less unnecessary e-mail per day. These claims are based on analysis by OVO Energy which assumes that one unnecessary email emits 1gCO2, which come from back-of-the-envelope calculations from 10 years ago. In reality, emissions from emails today are much lower, and experts have explained how and why these headlines vastly overestimate the potential emission reductions from avoided emails.
Technology companies can continue to play a big role in reducing the environmental impact of streaming, including through further efforts to increase energy efficiency – both in the near-term with new technologies and developing next-generation technologies – and investing in renewable energy to power their data centres and networks.
Sustainable design and coding could also help, such as further improving video compression. A recent study explored the potential energy and emission reductions of shifting YouTube music videos to audio only when playing in the background.
It is important to keep in mind the scale of emissions from digital technologies compared to other sectors, with digital technologies accounting for around 1.5% of global carbon emissions.
All sectors and technologies are needed to help achieve the goals of the Paris Agreement and digital technologies are no exception. In fact, digital technologies, such as AI, could help accelerate climate action. But, without sound climate policies, AI could end up just helping to make oil extraction cheaper or extending the lifetime of coal plants.
What is indisputable is the need to keep a close eye on the explosive growth of Netflix and other digital technologies and services to ensure society is receiving maximum benefits, while minimising the negative consequences – including on electricity use and carbon emissions.
Instead of relying on misleading media coverage, this will require rigorous analysis, corporate leadership, sound policy and informed citizens.
Methodology and sources
The analysis of the carbon intensity of streaming video presented in this piece is based on a range of sources and assumptions, calculated for 2019 or the latest year possible.
- Bitrate: global weighted average calculated based on subscriptions by country and average country-level data streaming rates from Netflix in 2019; resolution-specific bitrates from Netflix. Note: the calculated global weighted average is a slightly conservative assumption, since the country-level bitrate data excludes streaming via cellular networks, which typically have lower bitrates.
- Data centres: based on Netflix reported direct and indirect electricity consumption in 2019, the number of subscribers as of the end of 2019 and their average viewing habits and global weighted average bitrate (above). Note: this assumption is also conservative, since the reported Netflix electricity consumption data includes electricity use from studios and offices, which should ideally be excluded when calculating emissions from streaming.
- Data transmission networks: time-based energy intensity values (kWh per hour) based on emerging research from Malmodin (2020). Weighting of network type is based on Netflix viewing data by devices (95% fixed and 5% mobile). According to Malmodin, data-based energy intensity assumptions (kWh per GB) used previously are not suitable for high bitrate applications, such as streaming video.
- Devices: smartphones and tablets: calculations based on Urban et al. (2014) and Urban et al. (2019), iPhone 11 specifications (power consumption and battery capacity), and iPad 10.2 specifications; laptops: Urban et al. (2019); televisions: Urban et al. (2019) and Park et al. (2016), and weighted based on Netflix viewing data by devices (70% TVs, 15% laptops, 10% tablets, 5% smartphones). Note: due to a lack of usage data, these assumptions do not include energy use from set-top-boxes and gaming consoles which some TV viewers may be using. As a result, these figures likely slightly underestimate overall device energy use from streaming.
- Carbon intensity of electricity: based on IEA country-level and global data, and 2030 scenario projections.
Update 25/11/2020: This analysis was updated to include new data on viewing hours and new research on the energy use characteristics of data transmission networks at high bitrates, as well as the revised estimate from the Shift Project published in June 2020. The update also adds comparisons to other estimates widely quoted in the media.