
Global sea levels rising faster than previously thought, study shows
Robert McSweeney
01.14.15Robert McSweeney
14.01.2015 | 6:00pmScientists have a good idea of the different factors that contribute to sea level rise. But historical measurements of sea level change from the twentieth century don’t seem to match up to sum of all these individual factors.
A new paper, published in Nature, offers an explanation to this puzzle. The study finds that the amount of sea level rise during the last century is lower than scientists previously thought.
But the implication of this finding is that the acceleration in sea level rise seen in recent decades is more rapid than scientists thought, the study says. And the researchers say that melting ice sheets are the reason.
Balancing the books
Several different components contribute to rising sea levels rise, including water expanding as it warms, melting glaciers and ice sheets, and changes to how much water is stored on land.
Scientists calculate global sea levels in two ways: by taking direct measurements of sea levels, and by using models and observations to estimate the contribution of each of these components and then adding them together.
But this has presented scientists with a problem: the figures from the two methods don’t quite match for the twentieth century. In the latest Assessment Report from the Intergovernmental Panel on Climate Change (IPCC), observed sea level rise is estimated at 1.5mm per year from 1900 to 1990, but only 1mm per year when researchers calculate it by adding together the individual contributions.
Scientists have sought the answer to this enigma, and the new paper offers an answer. It says that there is no discrepancy, because historical observed measurements were overestimating sea level rise for much of the last century.
By eliminating the difference between the two types of measurements, lead author Dr Carling Hay at Harvard University tells Carbon Brief, they are able to close the sea level budget:
“To put it another way: the books are balanced.”
Incomplete records
Before the advent of satellite measurements in the 1990s, tide gauges were the main way scientists observed how sea levels changed. Tide gauges measure the height of the sea with reference to a fixed point, usually on land, meaning most measurements are taken along coastlines.
Tide gauges have their limitations, Hay says, with a lack of readings in the early twentieth century and in the southern hemisphere:
“The incompleteness of these records makes obtaining estimates of global mean sea level very difficult.”
In their study, Hay and her colleagues found another way of using the tide gauge records, as she explains:
“Local sea level differs from global sea level due to a variety of factors, including ongoing effects due to the last ice age, heating and expansion of the ocean due to global warming, changes in ocean circulation, and present day melting of land ice. All of these processes produce unique patterns, or ‘fingerprints’, of sea level change that can be modelled.”
By looking for these fingerprints in the tide gauge records, the researchers can then estimate the contribution each one makes to sea level change. Then by adding them all together, they get a new estimate of the rate of global change.
Acceleration of sea level rise
Using this approach, the researchers estimate sea level rise for 1900 to 1990 of 1.2mm per year. This is lower than the 1.5mm per year from the IPCC.
But they found a better match between the two sets of figures for the more recent period of 1990 to 2010, which both show faster sea level rise of around 3mm per year.
Slower sea level rise in the last century makes the increase in recent years appear even more rapid, Hay says. You can see this in the figure below.
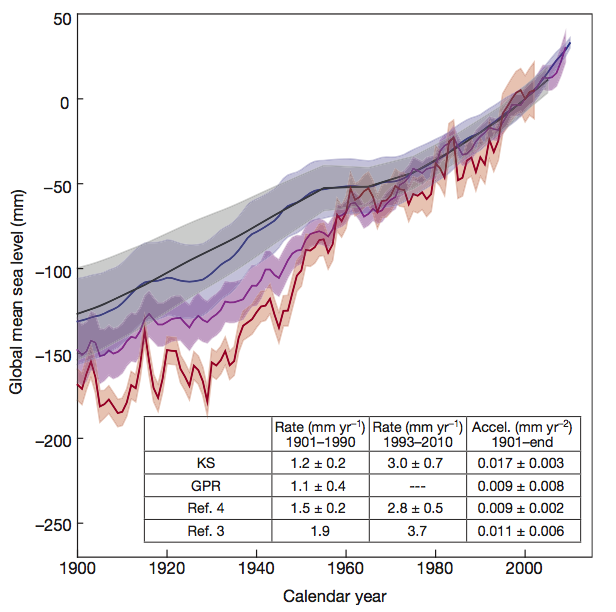
Time series of global mean sea level for the period 1900-2010. Figure shows estimates of sea level from the two methods used in this study: ‘KS’ (blue line) and ‘GPR’ (black line), and two methods used in the latest IPCC report: ‘Ref.4’ (purple line) from Church et al. ( 2011) and ‘Ref. 3’ (red line) from Jevrejeva et al. ( 2008). Inset table shows trends for three different time periods. Source: Hay et al. (2015)
For sea level rise to accelerate this quickly, Hay says, melting ice sheets would need to be making a “significant contribution” to sea levels in recent decades. And this is going to carry on through this century, she adds:
“The sea-level contribution from ice sheets is likely to increase in the 21st century as global mean surface temperatures continue to rise. Our results highlight the link between ice sheets melting and sea-level acceleration and the risks posed by future sea-level rise.”
Prof David Vaughan from the British Antarctic Survey says that balancing the books on sea level rise could mean better projections for the changes we’ll see this century:
“This paper goes a long way towards closing our understanding of the sources of twentieth century sea level rise. [It] is a step towards understanding historical changes and that could well increase confidence in projections.”
Main image: Water level marker on an old wooden bridge.
Hay, C.C. et al. (2015) Probabilistic reanalysis of twentieth-century sea-level rise, Nature, doi:10.1038/nature14093