
Guest post: A Met Office review of the UK’s record-breaking summer in 2022

Dr Mark McCarthy
09.28.22Dr Mark McCarthy
28.09.2022 | 3:53pmWith the summer of 2022 entering the climate record books as the first time that the UK has hit an air temperature above 40C, it has without question been amongst the UK’s hottest and driest summers overall.
Yet despite some extreme weather, the summer was also not short of newspaper columns drawing on memories of past heatwaves, most notably that of 1976.
So, as summer gives way to autumn, this review will look at some of the statistics from this exceptional summer and put it into the context of previous notable hot summers for the UK.
According to the Met Office national climate series from 1884 to present, the summer of 2022 was the fourth hottest summer for daily average temperature for the UK overall. It was marginally warmer than 1976 and behind only the summers of 2018, 2006 and 2003.
This year’s summer heat also saw dozens of locations across the country set new daily maximum temperature records – with 46 meeting or exceeding the previous UK record and seven hitting or surpassing 40C.
In terms of rainfall, 1995 is the driest summer on record for the UK, closely followed by 1976. These two summers were appreciably drier than the cluster of hot-dry summers of 2022, 2018, 2006 and 2003.
A hot, dry summer
The maps below show average conditions across the UK for the summer in terms of temperature (left), rainfall (middle) and sunshine (right). All data is shown as anomalies relative to the 1991-2020 average. The darker the shading, the more unusual the weather.
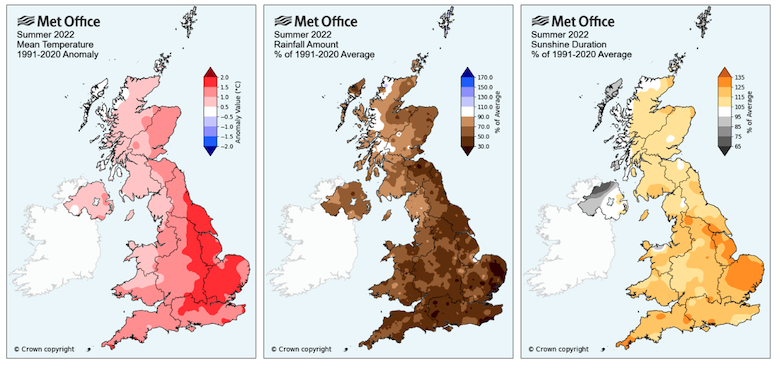
The 2022 summer was the joint-warmest for England, the eighth warmest for both Scotland and Wales, and the 12th warmest for Northern Ireland. It was also the warmest on record for many parts of eastern England.
For East Anglia and parts of south-east England it was the fourth driest summer on record.
For sunshine, it was just outside the top 10 sunniest summers for the UK overall (in a series from 1919), but Northern Ireland, the Western Isles and Shetland were the only locations that were duller than average. East Anglia again saw the highest anomalies and recorded its third-sunniest summer.
Research in the last few years has continued to add to the evidence base that illustrates climate change has already made UK summer extremes in temperature more likely, and has increased the severity of heatwave events when they occur.
Hitting 40C
The chart below shows the UK daily average temperature through the summer of 2022. Orange and blue shading indicates periods of above- and below-average conditions, respectively.
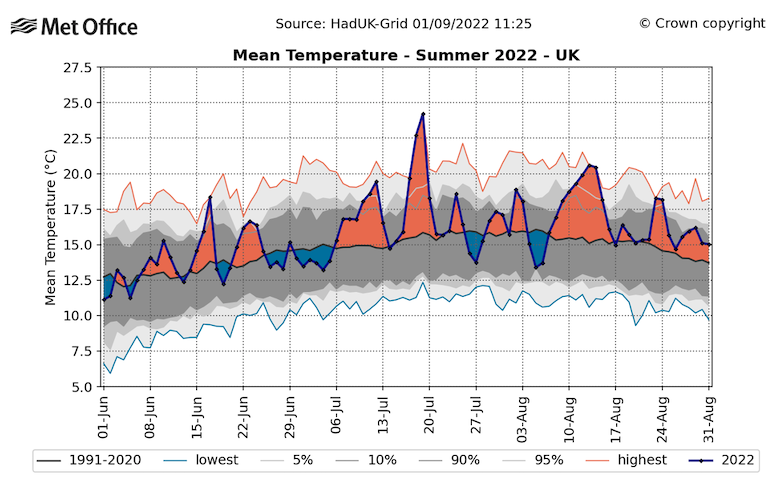
The summer of 2022 began relatively innocuously, with temperatures often slightly below the 1991-2020 average.
Temperatures for June peaked mid-month, reaching 32.7C at Heathrow in London and Santon Downham in Suffolk, but the most impactful weather during June resulted from spells of thundery showers and intense downpours.
July was dominated by dry and sunny conditions, with temperatures widely getting above 30C before the really exceptional weather in the heatwave of 16-19 July.
High pressure over central Europe and low pressure to the north-west of Scotland conspired to draw an exceptionally hot-dry air mass from southern Europe to the UK. The Met Office issued the first red warning for extreme heat since the inclusion of heat within the National Severe Weather Warning Service, and a level 4 alert for the UK Health Security Agency heatwave plan.
During the heatwave, temperatures peaked at 29.1C in London on 16 July, 33.0C in north Wales the following day and 38.2C in both Pitsford, near Northampton, and Santon Downham the day after that. The 18 July also saw a temperature of 37.1C recorded at Hawarden airport in Flintshire, setting a new record for Wales by a margin of 1.9C.
Then, on 19 July, the UK’s all-time high temperature record – 38.7C at Cambridge Botanic Gardens on 25 July 2019 – was broken by a margin of 1.6C. The previous record was met or exceeded at 46 stations across the UK observing network, at locations from Kent to North Yorkshire.
From these 46 stations, seven reached or exceeded 40C for the first time in the UK’s official record, peaking at 40.3C at Coningsby, Lincolnshire. For Coningsby, this temperature was more than 18C above the July climatological average for the site, while temperatures across the country were far outside the range of summer temperatures normally observed.
The northerly extent of the heat was also remarkable – a temperature of 38.8C was recorded at Leeming in North Yorkshire. Scotland also recorded its highest temperature on record with 34.8C at Charterhall in the Scottish Borders, while a temperature of 31.2C at Derrylin came within 0.1C of the Northern Ireland record, which had been set just one year before in July 2021.
Records tumble
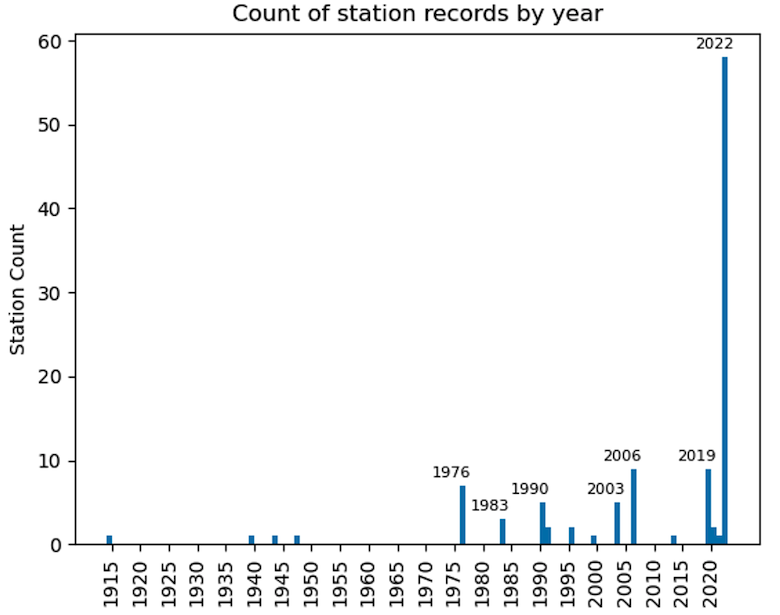
The Met Office has reports from more than 330 land surface stations during the heatwave of 2022 across the UK. Of these,109 have at least 50 years of observations, which therefore capture past heatwaves, including 1976.
As the map below illustrates, of these 109 stations, 58 recorded their highest temperature on record during July 2022 (red dots).
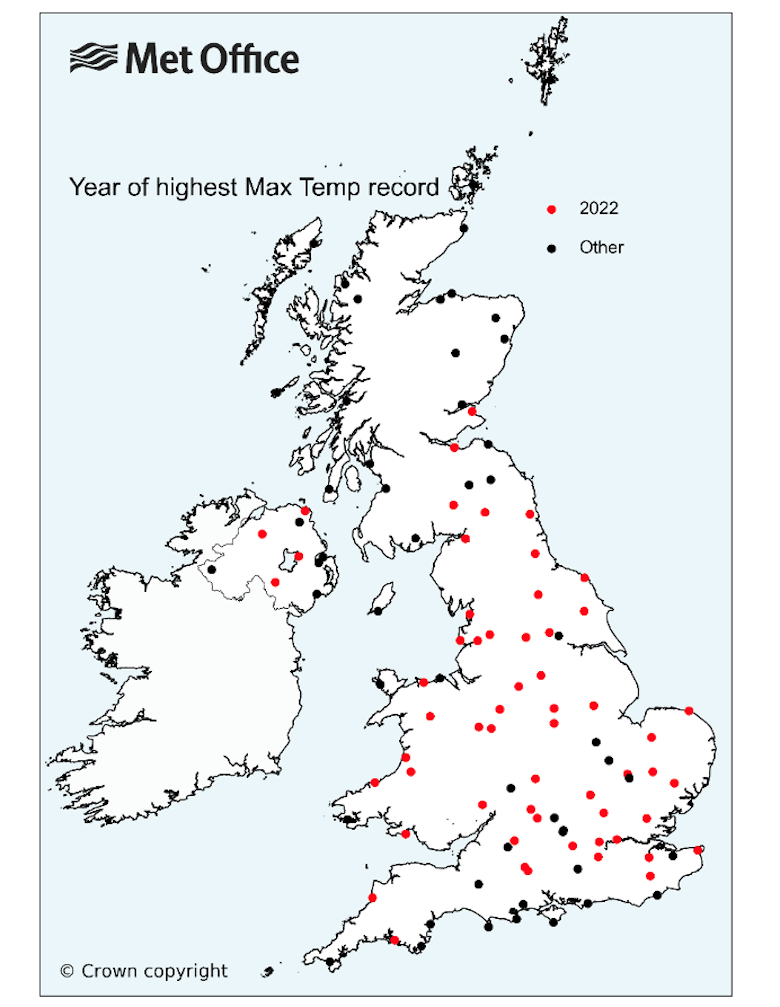
In total, 85% of station records occurred during heatwaves in the summers of 2022, 2019, 2006, 2003, 1990 and 1976. It is also worthy of note that each of the last four summers still hold at least one station record.
There is no room for doubt that the magnitude, extent and severity of the 2022 heatwave was unprecedented in a UK summer.
The heat was not confined to the daytime, with a new national record for high summer minimum temperature was also recorded. The temperature did not drop below 26.8C at Shirburn Model Farm, Oxfordshire for the 24 hours from the morning of 18 July, beating the previous record of 23.9C from Brighton, East Sussex in August 1990 by a huge margin.
It was also the most widespread recording of a tropical night for the UK, defined as a 24-hour period during which temperature remains above 20C. Tropical nights can be detrimental to human health as they deprive the body of respite from the heat overnight. Infrastructure can exacerbate these health implications as our homes and buildings struggle to lose the heat of the day, especially in cities where this can be further compounded by the urban heat island effect in which the cities themselves retain high temperatures much later into the evening and cool down more slowly overnight.
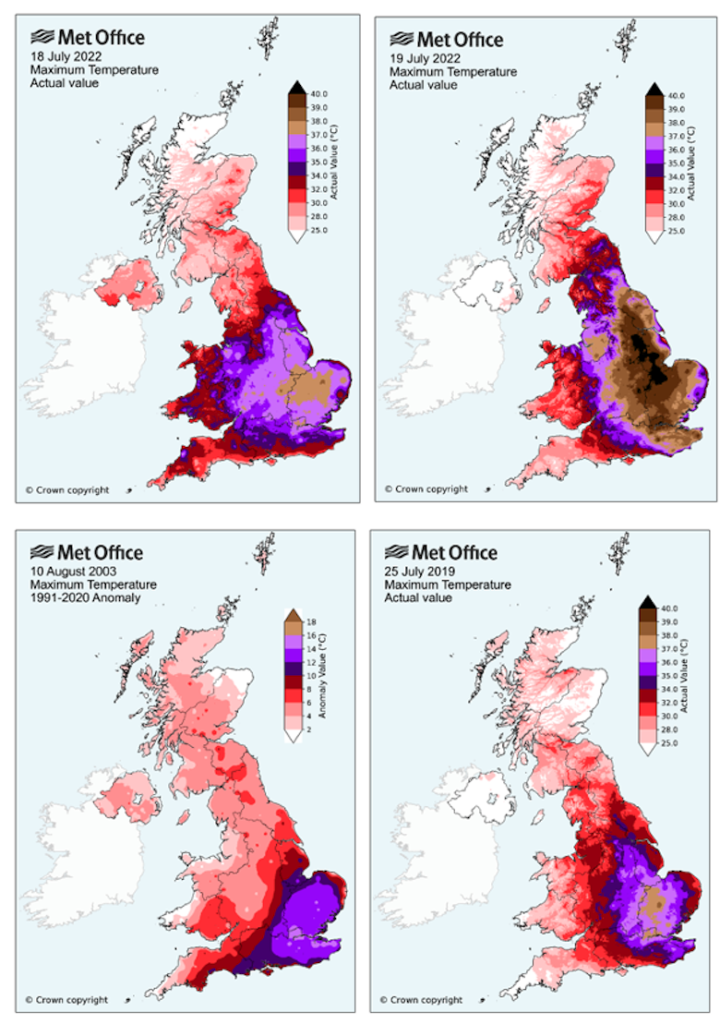
The maps below show the distribution of high temperatures for the two days of 18 and 19 July 2022 (top), compared to previous extreme hot days in July 2019 (bottom right) and August 2003 (bottom left), which are the only other occurrences of temperatures above 38C recorded in the UK. These highlight the unprecedented extent of the most extreme temperatures – shown by brown and purple shading – during the heatwave.
The extreme temperatures resulted in significant disruption to transport networks, with buckling tracks and sagging overhead cables on rail networks and melting runways at airports.
Major incidents were announced by a number of fire services as heat also triggered fires. The Office for National Statistics report stated that, during the period of the heatwave, average daily mortality rates were higher than at other times in July. This was more pronounced for deaths due to Covid-19, suggesting that excess deaths during this period are a combination of factors requiring further investigation to understand fully.
Thankfully, the extreme heat was relatively short-lived for the UK and temperatures returned to something closer to the climatological average for the remainder of July.
A further heatwave then developed through August, peaking at 34.9C at Charlwood in Surrey on 13 August as part of an eight-day sequence over 8-15 August with somewhere in the country exceeding 30C. A longer duration, but less severe summer heatwave.
In many past summers this August spell would have been regarded as a significant event in its own right, but it was rather overshadowed by the events of July.
So how do past heatwaves stack up? Which summer was the most extreme? The answer depends on a number of things, such as which metric you compare and which part of the country you are in.
Most extreme temperatures
The scale and extent of record breaking temperatures on 18-19 July 2022 make this summer the most extreme for severity of heat, being the first occurrence of temperatures above 40C and of two consecutive days where temperatures exceeded 38C.
The highest temperatures recorded in the UK have been increasing at a faster rate than the average temperature and in parts of the south-east of England have increased by as much as 1C per decade.
The figure below shows that years in which the temperature failed to exceed 30C used to be a fairly regular occurrence in the past, but has not happened since 1993.
It is also worth noting that not every year brings a new record. For example, a maximum temperature of 32.2C in 2021 is fairly low by modern day standards, but would have been a more typical value earlier in the 20th century.

The table below lists the top 10 hottest days recorded in the UK. It can also be noted that while containing two records from Heathrow airport in London, the list is not excessively dominated by major airports or our largest cities, and would not look substantially different if such locations were excluded.
| Rank | Date | Location | Highest Temperature (C) |
|---|---|---|---|
| 1 | 19 July 2022 | Coningsby, Lincolnshire | 40.3 |
| 2 | 25 July 2019 | Cambridge Botanic Gardens | 38.7 |
| 3 | 10 August 2003 | Faversham, Kent | 38.5 |
| 4 | 18 July 2022 | Pitsford, Northamptonshire | 38.2 |
| 5 | 31 July 2020 | Heathrow, London | 37.8 |
| 6 | 3 August 1990 | Cheltenham, Gloucestershire | 37.1 |
| 7 | 1 July 2015 | Heathrow, London | 36.7 |
| 8 | 9 August 1911 | Raunds, Northamptonshire | 36.7 |
| 9 | 2 August 1990 | Worcester, Worcestershire | 36.6 |
| 10 | 19 July 2006 | Wisley, Surrey | 36.5 |
Top 10 hottest UK days on record.
National records are also being held for much shorter periods of time. A temperature of 36.7C on 9 August 1911 held the UK high temperature record for 79 years until it was exceeded on 3 August 1990. This record held for 13 years until 2003, which held for 16 years until 2019, which held for just three years until 2022.
Following the heatwave of July 2019, colleagues at the Met Office came together to ask the question of how likely it would be to reach a temperature of 40C in the UK. The resulting analysis shows that climate change had already increased the likelihood of 40C by up to 10 times, although in our current climate it is still estimated to be a rare event with a return period of 1-in-100 to 300 years.
However, in a moderate emissions scenario that increases to 1-in-15 years by 2100, or 1-in-3 to 4 years for a high emissions scenario. And while the study notes that south-east England was the region most likely to see such temperatures, in 2022 they occurred in Lincolnshire and Nottinghamshire.
Duration of hot weather
An alternative view is the duration of high temperatures through the summer season.
The figure below shows the annual count of days in which the Central England Temperature (HadCET) series recorded a daily maximum temperature that was above 25C, as an indicator of duration of hot weather. The HadCET provides a daily series of maximum temperature back to 1878 representative of an area bounded by Hertfordshire, Worcestershire and Lancashire.

By this measure, the summers with the most persistent high temperature were 1976 and 1995, both recording 33 days, followed by 2018 with 31, then 1911 with 28.
Summer 2022 experienced an exceptional heatwave in July and a second extended heatwave during August, but does not challenge other summers for persistence of hot days.
However, there is also evidence of a general increasing trend in this metric too, with the average number of days above 25 rising from seven days for 1961-1990 to 11 days for 1991-2020.
Average temperature and regional variation
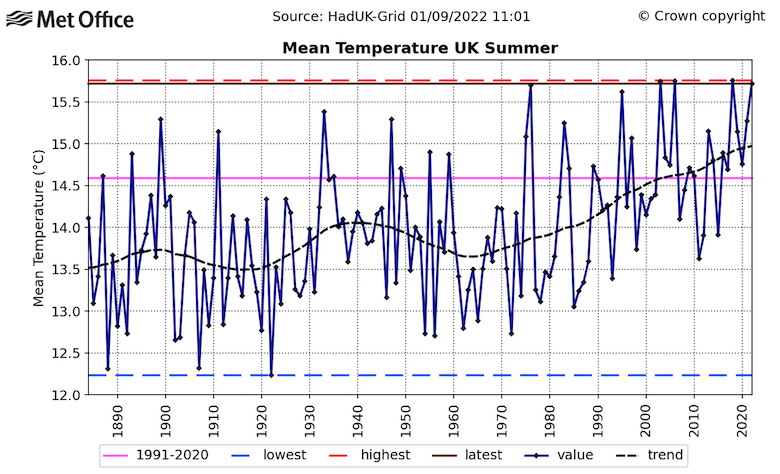
As the chart below shows, looking at the average temperature for the whole summer season from 1 June to 31 August (blue line), there is a clear warming trend.
The top 10 warmest summers for the national UK temperature series (from 1884 to present) and the longer HadCET series (from 1659 to present) are shown in the table below.
Of these, seven years are common to both series, with the HadCET series including only the summers of 1826 and 1846 from the period before the UK series began in 1884.
The five warmest years in the UK series are separated by just 0.06C, which is close to the estimated uncertainty around the calculation of UK-wide figures (0.04C). For the UK-wide series, 2018 is the warmest summer, while for HadCET it is 1976.
| UK Series | HadCET | |||
|---|---|---|---|---|
| Rank | Year | Temperature (C) | Year | Temperature (C) |
| 1 | 2018 | 15.76 | 1976 | 17.7 |
| 2 | 2006 | 15.75 | 1826 | 17.6 |
| 3 | 2003 | 15.74 | 2018 | 17.4 |
| 4 | 2022 | 15.72 | 1995 | 17.3 |
| 5 | 1976 | 15.70 | 2006 | 17.3 |
| 6 | 1995 | 15.62 | 2022 | 17.3 |
| 7 | 1933 | 15.38 | 2003 | 17.2 |
| 8 | 1947 | 15.29 | 1846 | 17.1 |
| 9 | 1899 | 15.29 | 1983 | 17.1 |
| 10 | 2021 | 15.27 | 1947 | 17.1 |
Top 10 highest summer average temperatures for the UK national series and the HadCET. The sampling uncertainty associated with the UK series is 0.04C and for the HadCET is 0.2C, so the series are quoted to a different level of precision. Credit: Met Office.
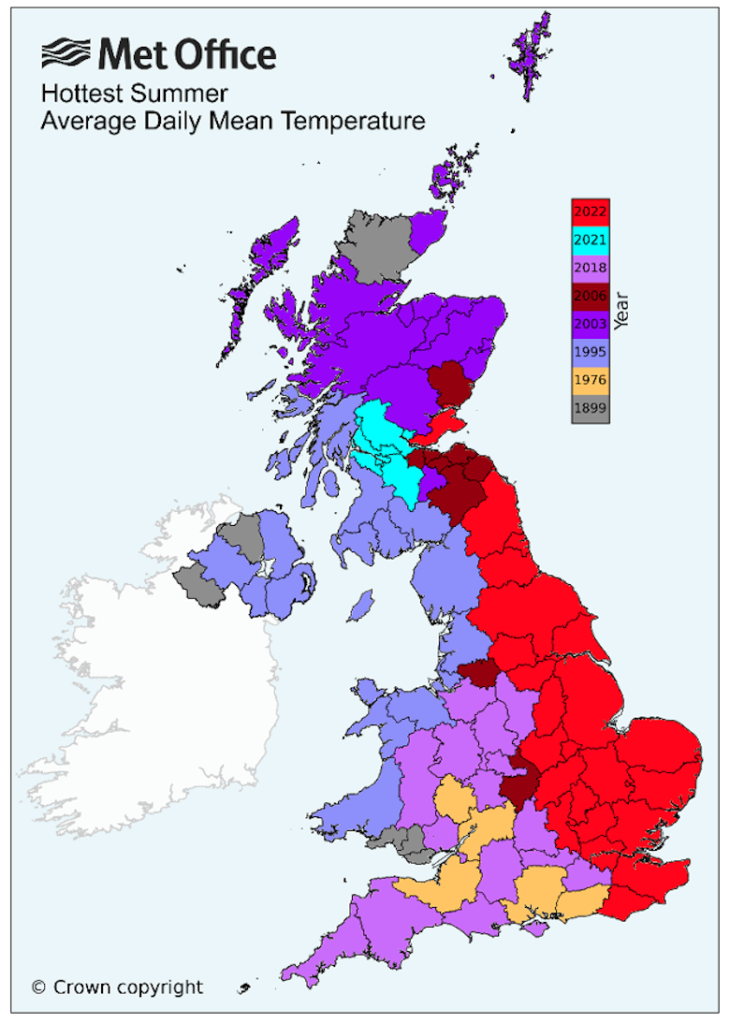
When looking at individual regions of the UK – as in the map below – the year of the hottest summer varies. Here, clear regional differences emerge. While 2022 (red shading) was the hottest summer for eastern counties of England (and Fife in Scotland), 2018 (dark pink) and 1976 (yellow) tend to be the hottest years for central and south-western England.
For west Wales, north-west England, south-west Scotland and Northern Ireland, 1995 (mauve) is the hottest summer. For northern Scotland, 2003 (purple) is the hottest year, while the summers of 1899 (grey), 2006 (dark red) and 2021 (light blue) also have some regional presence.
It can still be a source of confusion for some, but differences in the ranking of seasons between datasets are not contradictory. While 1976 remains the warmest summer overall for the HadCET and some counties and locations in southern England, 2018 is marginally the hottest summer for the UK overall. But this does not mean 2018 was the hottest everywhere, with 2022 taking the title for much of the east of the country.
A dry summer
With the exception of parts of north-west Scotland, it was also a notably dry and sunny summer. The largest rainfall deficits were found in East Anglia and south-east England.
The chart below shows summer rainfall (y axis) plotted against summer average temperature (x axis) for each year. Years from 2000 onwards are shown as orange dots, 2022 as red and the rest are in blue.
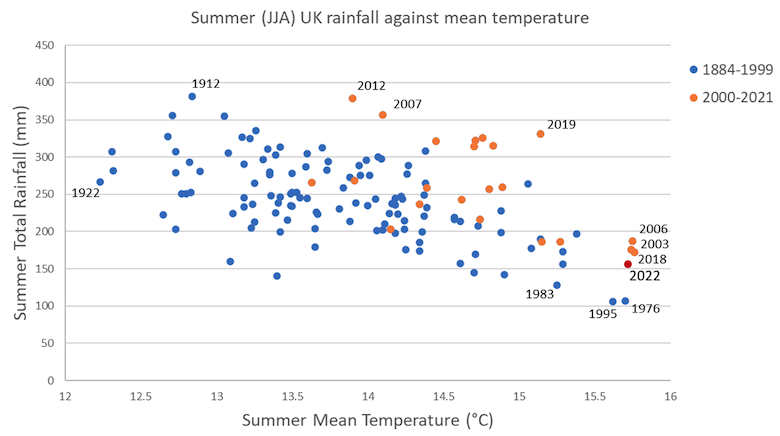
The chart shows that 1995 is the driest summer on record for the UK, closely followed by 1976 (in a series from 1836) and these two summers were appreciably drier than the cluster of hot-dry summers of 2022, 2018, 2006 and 2003.
However, where 2022 and 1976 have some further similarity is that in both these years there was an extended multi-month dry spell that also preceded the summer season. In the case of 1976, it was an exceptionally dry spell from May 1975 to August 1976. And for the period November 2021 to August 2022, only February was wetter than average.
Exceptional summer
Overall, 2022 was an exceptional summer season for the UK climatologically. It was most notable for the extreme heat of 18-19 July, recording temperatures in excess of 40C for the first time, and breaking the previous all-time temperature record across a region stretching from Kent to North Yorkshire.
The summer average temperature in 2022 was close to that of 2018, and of other top ranking summers. Research published following the summer of 2018 suggested that climate change to date has resulted in a roughly 30-fold increase in the likelihood of a summer average temperature at least as high as 2018.
That 1976 remains a significant event in the UK’s climatological – and social – history is factually correct, particularly for the persistence of hot and dry conditions through that summer. However, the existence of severe heatwaves in the past does not provide evidence against the impact that climate change is having on our summer temperatures. Rather, they act as an important reminder that heatwaves have always been a severe and impactful weather event for the UK.
Nonetheless, the body of evidence continues to grow showing that climate change is making such extremes more frequent, more likely to occur and more severe.


-
Guest post: A Met Office review of the UK’s record-breaking summer in 2022