Guest post: Authors respond to misinterpretations of their 1.5C carbon budget paper

What did our article do?
We estimated the remaining “carbon budget” – the amount of CO2 that could be released from 2015 onwards – consistent with meeting the most ambitious part of the Paris Agreement long-term temperature goal, namely “pursuing efforts to limit global warming to 1.5C above pre-industrial levels”.What were the conclusions?
That the carbon budget “likely” (see note 1, below) to be consistent with 1.5C of human-induced warming is about 200-240 gigatonnes of carbon (GtC, or 730-880GtCO2) from the beginning of 2015, depending on how rapidly we cut back on non-CO2 contributions to global warming. Here, we interpreted 1.5C as being 0.6C of warming above the present decade (2010-2019), using an estimate of human-induced (“attributable anthropogenic”) warming (note 2) by 2015 of 0.93C above mid-19th century values (see discussion below on our choices of reference periods and datasets). This carbon budget represents around 20 years of present CO2 emission levels, equivalent to reducing emissions in a straight line to zero by 2055. This estimate was based on Earth System Models (ESMs) that account for both physical climate and carbon cycle processes and their associated uncertainties, and we also obtained similar estimates using simpler models and different scenarios for uncertainty analysis. Our estimates indicate a marked change in the remaining budget compared to estimates inferred from the same model simulations as reported in the Intergovernmental Panel on Climate Change (IPCC)’s Fifth Assessment Report (AR5).How come?
The estimates inferred from AR5 were based on the difference between two very large numbers: calculating a 1.5C budget for carbon emissions from 1870 in ESMs, and then subtracting estimated cumulative historical emissions to date, to estimate the remaining budget. Instead, in our paper, we estimated cumulative emissions and temperature changes relative to the present decade. Small uncertainties in our understanding of the present-day state of the climate system are much more important in relation to near-term climate targets (such as 1.5C) than they are for the less ambitious targets that were the primary focus of AR5. In our judgement, our resulting estimate of projected warming per tonne of CO2 emitted in the future is equally or more in line with other lines of evidence presented by AR5, including, for example, forecast warming for the 2020s, as shown in our figures 2c and 3a.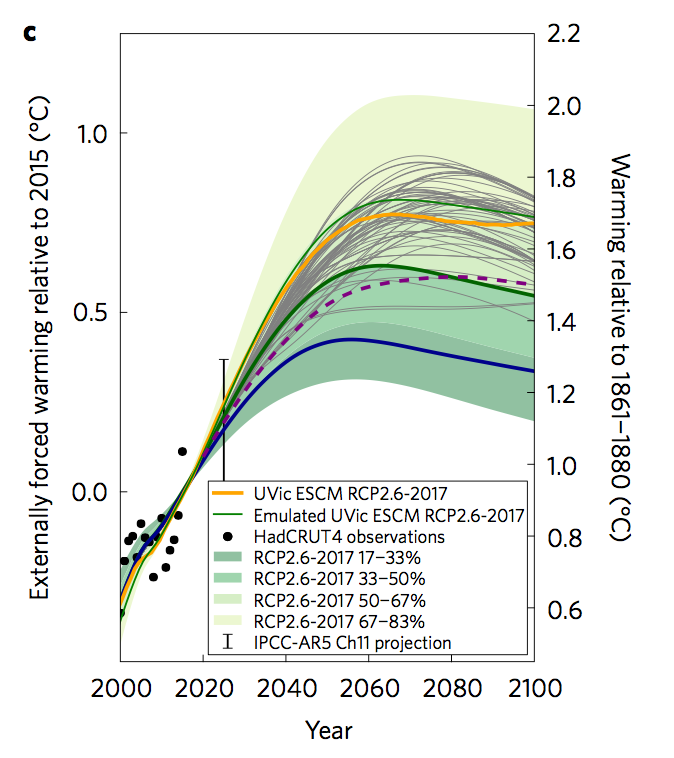
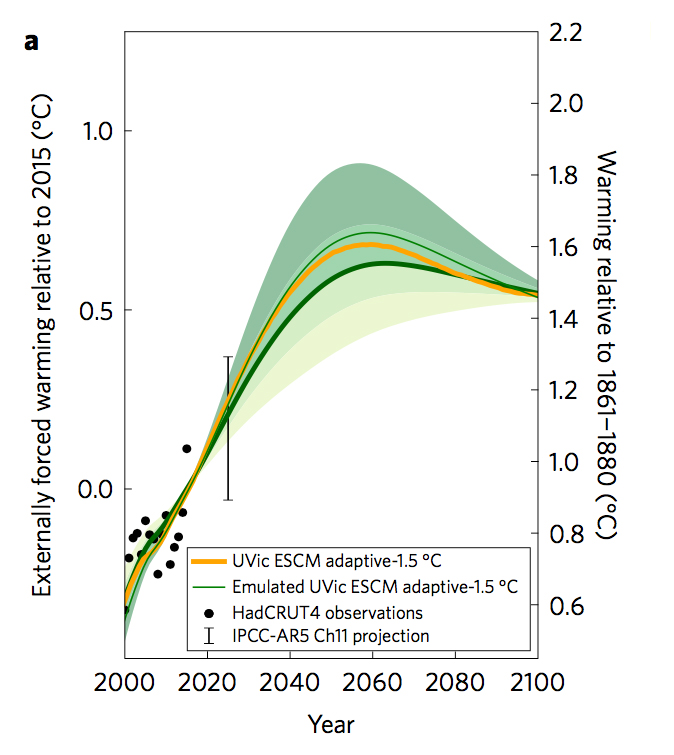
There’s been a media storm – have there been big misunderstandings?
Yes. The largest misunderstanding surrounded a sentence in our paper (note 3) which was erroneously interpreted as stating the observed warming as of 2015 is 0.3C less than the projections in AR5 and, hence, that the AR5 projections of future temperature change should be downgraded. This is not true and we did not say that either in the paper or in associated briefings. Taking into account multiple lines of evidence, including the evidence provided by the “CMIP5” multi-model ensemble, the IPCC authors projected a warming range of 0.9 –1.3C by the 2020s (0.3-0.7C above 1986-2005), which is consistent with observed warming to date and with the findings of our paper, as demonstrated in our figures 2c and 3a. It was noted in AR5 and in our briefings that some (not all) of the CMIP5 models project higher levels of warming for the 2020s and are already warmer than observations, for reasons that include differences between observed and scenario non-CO2 climate drivers and in the variables used to define global average surface temperature, detailed below. Since there was no evidence that this indicated a systematic bias in the models’ response to rising CO2 concentrations, it does not preclude continued use of these models, nor was it considered relevant to projections of higher warming levels, which are dominated by CO2. Past warming and non-CO2 climate drivers play a much larger role in near-term forecasts or ambitious climate goals such as 1.5C, hence motivating our paper. We present no evidence in our paper to suggest that future CO2-induced warming under any emissions scenario will be lower than the projections given in AR5. Our new analysis is based on the same set of model simulations used by the authors of AR5 and uses the same estimates of the climate response to CO2 emissions as used AR5. There is nothing in our paper that questions fundamental climate science, or affects any of the science concerning climate impacts and risks. Some discussion has focused around the extent of “baked-in” (committed) warming from past emissions. For the case of CO2 emissions, this already committed future warming is likely to be small, since expected future warming from ocean thermal inertia is largely cancelled out by continued ocean carbon uptake (carbon cycle inertia). This means that future CO2-induced warming is dominated by future (not past) CO2 emissions. However, committed future warming from non-CO2 (aerosol and greenhouse gas) emissions may be more important, and will depend crucially on future changes in the amount of cooling from aerosol emissions as compared to the amount of warming from non-CO2 greenhouse gas emissions, both of which are anticipated to decrease as a results of mitigation efforts. In the ambitious mitigation scenario we used in our paper, future reductions in aerosol cooling are approximately balanced by reduction in warming from short-lived greenhouse gases. However, this balance may evolve differently in reality, which would, therefore, have an effect on the carbon budget.So what accounts for the difference in estimated carbon budgets?
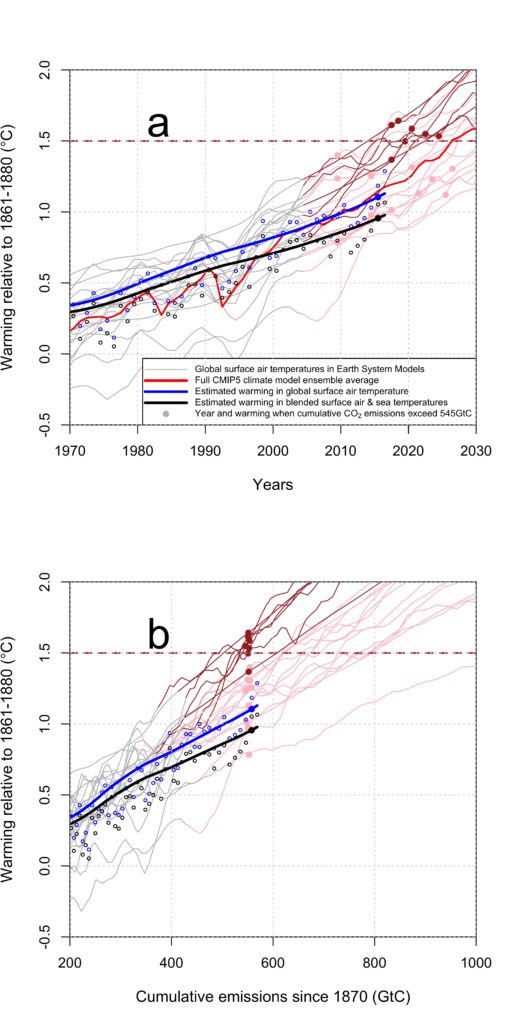
The largest factors that explain our increased budget estimate are: 1. Differences between modelled and observed estimates of the current climate/carbon-cycle state There is a well-established straight-line relationship between cumulative CO2 emissions and CO2-induced warming in both climate models and observations. However, the ESMs that have been used to estimate carbon budgets – a subset of the full CMIP5 ensemble and including some models of intermediate complexity – are driven with multiple climate drivers and exhibit a range in simulated warming from 0.8C to more than 1.5C at the time modelled cumulative CO2 emissions reach 545GtC, the level they were thought to have reached in the real world in 2015 (see figure below). Three factors contribute to this range:a. Mismatches in the dates at which cumulative CO2 emissions reach 545 GtC. In the CMIP5 experiments, models are forced by concentrations, not emissions. To infer emissions, an active carbon cycle is required. Most of the ESMs simulate lower than observed average CO2 emissions over the historical period due to accumulated small differences between observed emissions and emissions as inferred from the models (note 4, below). Most of this occurred before 2000 and does not suggest that the models are systematically over- or under-estimating the fraction of human CO2 emissions that resides in the atmosphere at present. But, as a result, cumulative emissions in about half the models do not reach 545GtC until after 2020, by which time both atmospheric concentrations are significantly above their 2015 values. In models warming at 0.2C per decade, 5 years accounts for 0.1C of warming.
b. Differences between observed non-CO2 drivers of climate change since 2005 and those applied to the models. The CMIP5 models were driven with scenarios for atmospheric composition from 2005. These scenarios differ from the real-world composition for the past decade. It has been shown (for example Medhaug et al, 2017) that use of actual composition would reduce model-simulated warming by 2015 by about 0.1C.
c. Global average surface temperature is defined slightly differently between these models and the observational dataset used in our study. Models use area-average surface air temperature, while the observational datasets used in key figures in AR5 use a blend of observed surface air and seawater surface temperatures where observations exist. Richardson et al (2016) show this can account for a further 0.1C difference between model output and such observational indices.
The difference is not the result of internal variability, because we are comparing decadally-smoothed model simulations with an index of observed human-induced warming to which the contribution of internal variability has been minimised. This is important, because if the observations were temporarily cooler than the models simply because of internal variability, we would expect that difference to disappear in future. Our estimate of the level of externally driven warming (about half-way between observed 2014 and 2015 temperatures) is almost identical to that of Medhaug et al (2017) when a like-for-like comparison is performed (their figure 5). The one-third of ESMs that simulate the warmest temperatures for a given cumulative amount of inferred CO2 emissions determine the carbon budget estimated to keep temperatures “likely below” 1.5C. By the time estimated cumulative CO2 emissions in these models reach their observed 2015 level, this subset simulates temperatures 0.3C warmer than estimated human-induced warming in 2015 as defined by the observations used in AR5 (see figure below). It is this level of warming for a given level of cumulative emissions, not warming by a given date, that is relevant to the calculation of carbon budgets. Because CO2 concentrations differ between 2015 and 2020, comparing warming in observations and models across those dates does not tell us about how sensitive models are to increasing atmospheric CO2. Our paper does not argue that the CMIP5 ensemble as a whole, or the subset used for carbon budget calculations, is systematically over-responding to CO2 concentration increase. Hence, we subsequently use these same models to project warming from 2015 onwards. 2. Treatment of non-CO2 climate drivers The carbon budgets reported in AR5 were based on the highest (RCP8.5) concentration scenario, which includes strong contributions of non-CO2 emissions to warming. If non-CO2 warming is decreased, the space remaining for warming caused by CO2 is greater, and the carbon budget for any given level of warming increases. As seen in Table 1 and 2 of our paper, moving from RCP8.5 to RCP2.6 non-CO2 drivers increases our budget estimate by about 20%. 3. Definition of “1.5C relative to pre-industrial temperature” Five years have gone by since the analyses used in the last IPCC report. Surface temperature records have continued to improve in quality and comprehensiveness. In our paper, we estimated that the human-induced contribution to global mean surface temperature (GMST) change relative to pre-industrial, as defined at the time of writing of the Paris Agreement (note 5), in the year 2015 was 0.93C. Choice of reference period: We selected 1861-1880 for consistency with AR5 carbon budget calculations (Figure SPM10 of WG1). This period was chosen in AR5 as the earliest period with reliable near-global temperature data, and in which there is no evidence of large volcanic activity. In other key figures of AR5 (e.g. Box SPM1, figure 1, of WG2) the period 1850-1900 is used “as an approximation of pre-industrial levels”, which is 0.02C cooler than 1861-80, hence increasing our 0.93C to 0.95C. It has been pointed out (for example Schurer et al, 2017) that the use of a much earlier 1401-1800 reference period could add a further 0.1C (although varying this reference period, or choosing an even earlier one, can change the size of this effect), but as far as we can tell, the Paris Agreement (through its reliance on the Structured Expert Dialogue) was using 19th century temperatures to represent “pre-industrial”. Changing the reference period would equally affect both our estimate and the AR5 estimate of the remaining budget. Definition of Global Mean Surface Temperature (GMST): Our use of HadCRUT4 has been criticised because it is at the low end of estimates of warming in currently-available global temperature datasets. If the differences between these GMST datasets were attributable to random errors, this would be a valid objection, but they are not. They arise primarily because of different methodological conventions in the definition of GMST. HadCRUT4 defines GMST as the average of northern and southern hemisphere temperatures each calculated as a simple area-weighted average over regions with observations, using sea-surface temperatures (SSTs) over the oceans and surface air temperatures (SAT) over land. Other datasets that convert SSTs to SAT and/or use statistical models to estimate temperature estimates over regions without long-term observations (mainly Arctic, Antarctic and Africa) can give significantly higher estimates (by up to 0.2C) of warming to date, but would also have given higher levels of warming than were reported to the Structured Expert Dialogue, which confined itself to datasets assessed by AR5. The UNFCCC has not adopted a preferred definition of GMST, and until they do so, we feel it is justified to use a definition that approximates that which appears to have been used to provide the science background to the Paris negotiations.
Article information
The authors of this guest post, and the paper, are Richard J Millar, Jan S Fuglestvedt, Pierre Friedlingstein, Joeri Rogelj, Michael J Grubb, H Damon Matthews, Ragnhild B Skeie, Piers M Forster, David J Frame and Myles R Allen.