Guest post: A closer look at China's stalled carbon emissions

Chinese coal consumption dropped for the third year in a row in 2016, while CO2 emissions grew only slightly. But uncertainty is high and the longer-term trend is still unclear.

The third consecutive annual fall in coal consumption, reported in newly released preliminary data for 2016 from the Chinese government, comes despite signs of a rebound last Autumn. As a result, CO2 emissions are still relatively flat, our analysis of this new data suggests, probably growing only around 0.5% from 2015.
The new data boost confidence that the slowdown in Chinese emissions is structural and not just a short-term deviation. But it is still too early to say whether Chinese emissions have peaked, plateaued, or will start to curve upwards again.
Coal consumption down, CO2 emissions flat
China’s National Bureau of Statistics (NBS) released its annual “Statistical Communiqué” on 28 February, with preliminary statistics for 2016 on everything from economic growth and industrial production to the number of forest fires and medical personnel.
In the past few years, the numbers on energy consumption in the communiqué – particularly coal – have been closely watched. In the two previous years, the communiqués showed that coal consumption dropped in both 2014 and 2015, and suggested that total CO2 emissions had stagnated, or even gone down.
They also showed a dramatic reduction in the growth rate of many industrial products, such as cement and steel. This prompted hope that the country is transitioning to a more service-oriented and less energy-intensive economy, in line with official policy, but also fear of an economic slowdown that could put millions of industrial workers out of work.
The numbers published in the 2016 communiqué, combined with data for 2015, show that coal consumption has now dropped for the third year in a row, by 1.3%, if measured in terms of the energy contained in the coal. The communiqué claims that it fell by 4.7%, if measured in tonnes, although this number seems implausible – see below for further discussion. Regardless, this is a long way from the 2000s, which frequently saw annual growth of 10%, or even more.
Oil and gas saw continued strong growth. Combined with renewed growth in cement production, they most likely combined to push CO2 emissions slightly up relative to 2015 (see chart below).
The Chinese government does not release annual statistics on CO2 emissions, but based on energy consumption and cement production data we estimate that CO2 emissions grew by approximately 0.5% from 2015 to 2016, or just 0.2% if adjusted for the fact that 2016 was a leap year and contained one more day than 2015. Given typical uncertainties in Chinese energy statistics and emission factors, this is practically the same as saying emissions were flat.
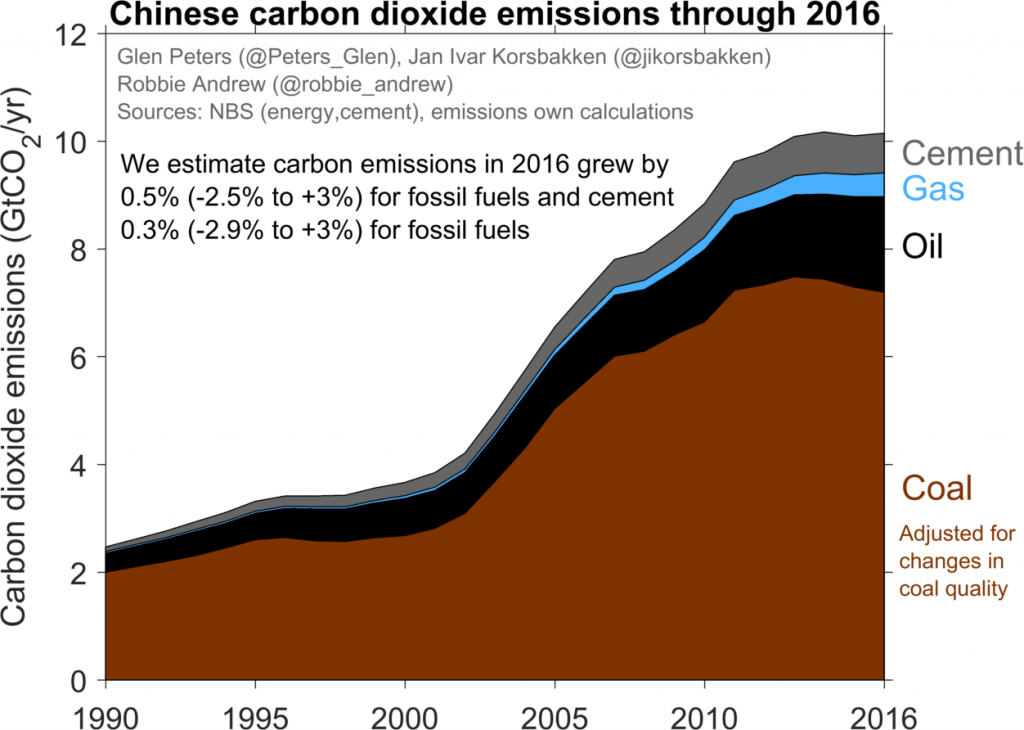
Near-term changes in coal consumption are key to which way CO2 emissions will go in the coming decade, despite the growing importance of oil, gas and cement in emissions growth. Coal still accounts for 62% of total energy consumption and 71% of total CO2 emissions from fossil fuels and cement.
Barring a dramatic slump in the Chinese economy (even more than we have seen until now), oil and gas consumption are bound to keep growing in the medium term, on the back of increased transport demand and government policies to increase gas consumption to stem air pollution from coal burning.
Cement production may go up or down, depending on construction and infrastructure investments, but is, ultimately, not a big enough source of emissions to be decisive.
Coal consumption could also go both ways. It could decline even further, despite economic growth, if the economy continues the shift away from coal-intensive heavy industries and towards service sectors. The decline in coal consumption for the third year in a row is, therefore, an encouraging sign.
On the other hand, despite the downwards trend in coal consumption, cement, steel and coal-fired power production – three of the biggest coal-consuming sectors – all grew again in 2016 after having fallen in 2015. Monthly statistics, furthermore, suggested an upwards curve in coal consumption during the latter half of the year. Continued decline in coal consumption cannot be taken for granted.
Start of a trend reversal?
At the end of June 2016, monthly industry statistics suggested that coal consumption in the first half of the year was down 4.6% relative to the first half of 2015. If that reduction had persisted, total CO2 emissions could have gone down by almost 2%.
In fact, in the annual Global Carbon Budget 2016 published in November 2016, we still estimated that Chinese emissions would be down 0.5% for the year, based on monthly data through September, albeit with a wide uncertainty range from 3.8% down to 1.3% up.
But monthly coal consumption started growing again in the second half of 2016 (relative to the second half of 2015), and total annual consumption ended at just 1.3% down by the end of December, leading to our estimated increase in emissions of 0.5%.
The question remains whether this growth trend will continue into 2017 and beyond.
Most of the July-December 2016 rebound in coal consumption came from increased coal-fired power production. The main reason was that growth in renewables and nuclear power could not keep up with increased electricity demand, even though some sources have cited a drought-induced drop in hydropower output as a factor in the rebounding coal consumption.
During July-December 2016, electricity demand was more than 9% higher than the same period in 2015, mainly due to a surge in heavy industry as well as high demand growth from service sectors and households. More than 75% of the extra demand was covered by coal-fired power, which increased by more than 10% relative to the same period in 2015.
Hydropower output was more or less unchanged, possibly due to lower precipitation. Even so, hydropower output would have had to grow by almost 40% if it were to have displaced the increase in coal-fired power generation, an unrealistic prospect regardless of the weather.
Coal is still by far the dominant power source in China and the growth in the second half of 2016 serves as a timely reminder that continued reductions in coal consumption and associated CO2 emissions depend on both fast growth in other power sources and energy efficiency or other measures to curb demand growth.
The almost extreme increase in coal-fired power generation can account for most of the coal rebound in the second half of 2016 and may not be a long-term trend that will stymie further coal consumption decline in the coming years.
However, the coal-intensive industrial products steel and cement also saw renewed growth, after having fallen in 2015. This could be a short-term stimulus-driven trend caused by government efforts to prop up GDP growth rates that were falling too fast for their liking.
But if it is either the start of a more lasting demand-driven trend, or if stimulus continues, it could put a brake on further drops in coal consumption over the coming years.
Uncertainty galore
The uncertainty in preliminary Chinese energy and emissions data is quite high. Our conclusions should be interpreted accordingly. Energy statistics are subject to sometimes considerable revisions, both during the first year after the initial preliminary release and in five-yearly revision cycles based on new data from economy-wide censuses.
Based on past revisions alone, we estimate that even though +0.5% is the most likely value for Chinese CO2 emissions growth in 2016 relative to 2015, the actual value could be anywhere from 3% up to 2.5% down (see chart above).
This year, there are even more sources of confusion in the coal data than usual. The statistical communiqué reported that coal consumption in 2016 had fallen by a whopping 4.7% when measured in weight (tonnes), compared to just 1.3% when measured by how much energy it contains (joules).
A gap between these two numbers is not unusual, as the energy content in a tonne of coal can vary considerably, but the size of the difference this year is extreme. Confusingly, the China Coal Industry Association estimated that coal consumption measured in tonnes fell by 1.3%, not the 4.7% reported by the government statistical bureau.
If the drop of 1.3% in coal consumption measured by energy content in the statistical communiqué and the drop of 1.3% measured in tonnes from the Coal Industry Association are both correct, this would imply no significant change in the average energy content per tonne of coal from 2015 and 2016, since the amount of energy and the number of tonnes both went down by 1.3%.
This is more consistent with monthly industry data and with demand in industry and in the power sector, all of which suggests the reported 4.7% fall may be incorrect.
Only the growth rate in terms of coal energy content is relevant for calculating CO2 emissions, so the disagreement does not affect emission estimates. It does, however, raise questions about the reliability of the data.
In an additional twist, supply-side data appear to imply that the reduction in coal consumption should be much greater even than 4.7%. The sum of coal production, net imports and coal taken from inventories – so-called “apparent consumption” – should, in principle, be equal to total coal consumption.
But apparent consumption for 2016 gives a number 6.4% lower than in 2015. It is tempting to speculate that the 4.7% reduction in coal consumption by weight in the statistical communqué is an attempt by China’s statistical bureau to reconcile the supply- and demand-side data, but that is purely speculation at this point.
The supply-side data may, however, be fundamentally flawed. It includes a 9.0% drop in coal production, which may not be trustworthy. Chinese authorities imposed strict measures in 2016 to close mines and reduce production, in order to curb growing overcapacity and mounting losses in the coal industry.
However, the restrictions create an incentive to under-report production. This could mean that real production has fallen less than the official statistics. This would be analogous to the situation in the late 1990s, when the government also tried to close many small coal mines, some of which kept producing without reporting, leading to too low production numbers that later had to be revised up.
More answers in 2017?
Despite uncertainty and confusion about the numbers, the 2016 data is one more piece of evidence that China will not return to the days of skyrocketing coal consumption for good, and that the world’s largest CO2 emitter is on the right path to start reducing its emissions permanently at some point in the coming decade.
Whether those reductions are imminent or can happen without a great deal of economic pain and unemployment remains unclear. 2017 may yet be the year that we start to see the outline of an answer.
Update 2/3/17: We added some additional information from the authors.