Guest post: How changes to coal mining have affected China’s methane emissions

Bobing Qiu
03.19.26Bobing Qiu
19.03.2026 | 1:36pmMethane, a potent greenhouse gas, is responsible for about 30% of the global temperature increase observed since the industrial revolution.
China accounts for more than 10% of annual global human methane emissions, in large part due to unintended releases – known as “fugitive” emissions – from its energy sector.
In a recently published study, we take a closer look at China’s coal-mine methane (CMM) emissions, which account for roughly 40% of the nation’s total methane emissions.
Leveraging newly collected, mine-specific data, we develop granular estimates of CMM emissions in China since 2000.
These estimates reveal that China’s coal production is shifting towards provinces with lower-emission mines.
In addition, there has been a significant increase in the capturing of methane from coal mines for energy use.
Together, these developments have helped to limit the rise of CMM emissions, despite an overall increase in coal production since 2016.
Mine data
To estimate CMM emissions at a granular level, we needed to understand how emissions vary from one mine to the next across China.
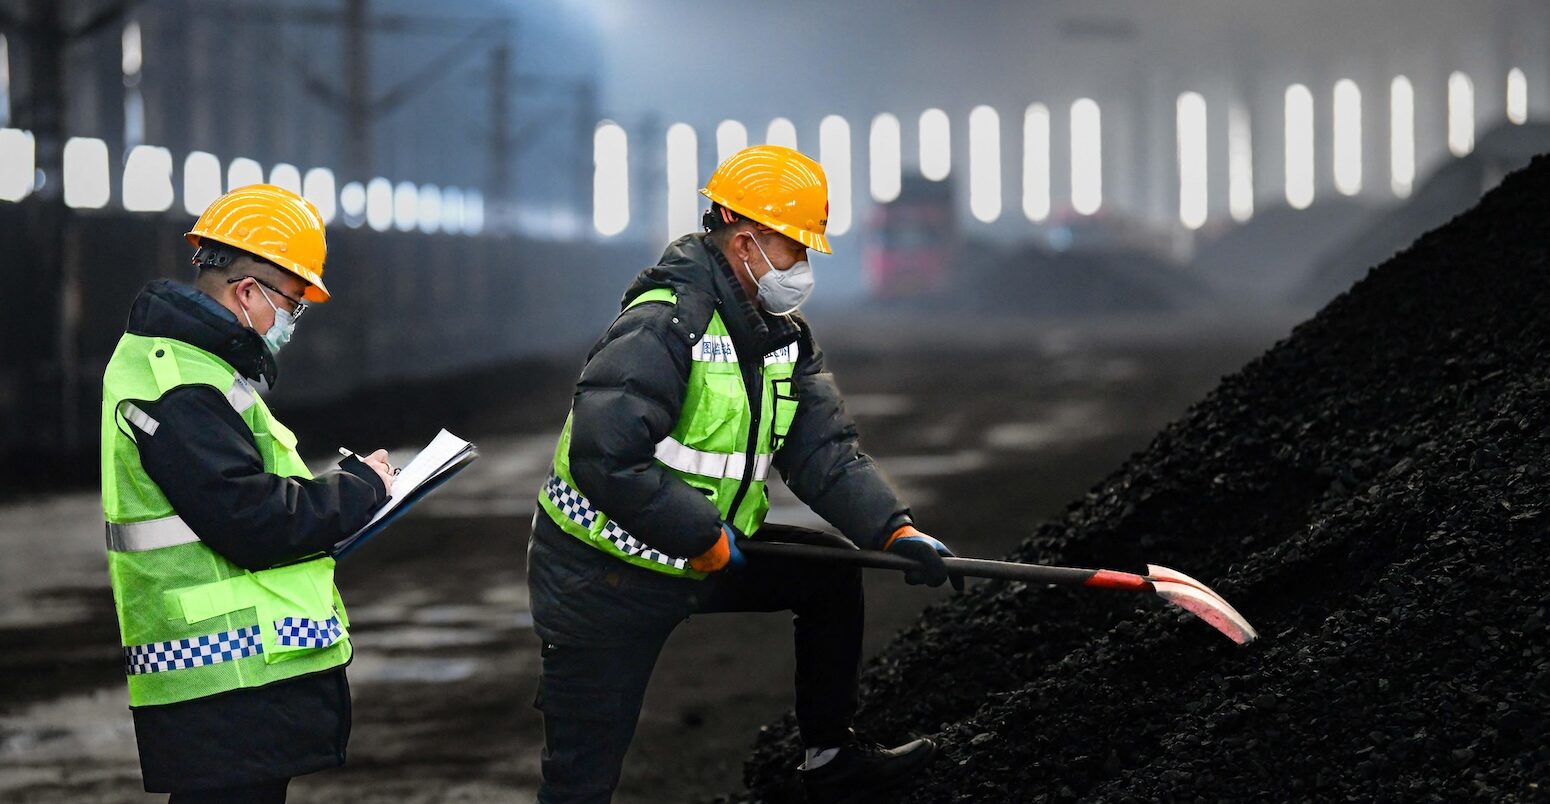
To do this, we made use of existing safety regulations in China. As methane is a highly flammable gas, the Chinese government enforces mandatory methane gas level identification in coal mines and implements safety regulations accordingly.
Coal mines are categorised based on their “methane emission factors”, the volume of methane emitted per tonne of coal produced.
At one end are low-gas mines, with an emissions factor of less than 10 cubic metres (m3) of methane emitted per tonne of coal. At the other are high-gas mines, at more than 10m3 of methane emitted per tonne. Beyond this are “outburst” mines, which are those that have experienced coal seam or gas outburst incidents.
To get a clearer sense of how much low-gas, high-gas and outburst mines emit in practice, we built a model of the relationship between gas levels and emission factors, using a 2011 database of all Chinese coal mines.
This database includes information on methane gas levels, mine-specific emission factors, coalbed depth, mine ownership and production capacity. We further validated this relationship with newly collected coal mine data from 2023, published by Chinese local governments.
The results show that the distribution of emission factors, as shown in the figure below, varies significantly with gas level.
The top row in the figure below shows the emissions factors for a range of mines in 2011 classed as low-gas (top left, green), high-gas (top centre, pink) or outburst (top right, red). The dashed vertical lines show the central estimate for each type, ranging from 4.1m3 per tonne for low-gas mines through to 19.9m3/tonne for high-gas and 28.4m3/tonne for outburst mines.
The bottom row shows the same metrics based on the more recent 2023 data.
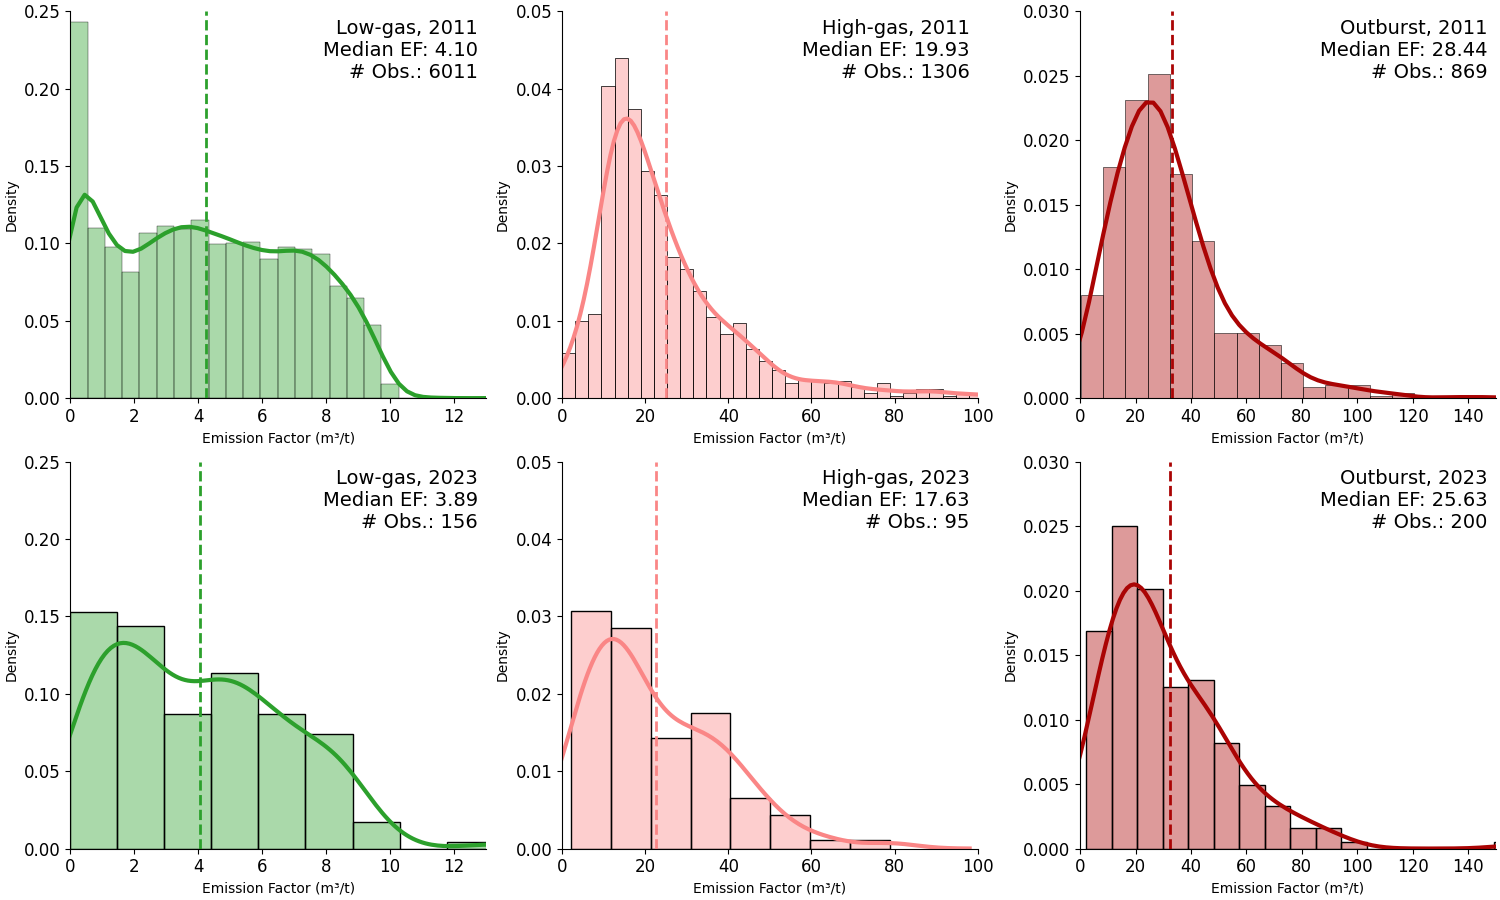
The strong correlation shown in the data above suggests that gas level is a crucial indicator of how much methane a coal mine emits.
In contrast, our analysis reveals no significant correlation between how much a coal mine emits and either coal mine depth or ownership.
Comparing the distributions for the same gas levels between 2011 and 2023 also shows that the link between gas levels and methane emissions remains fairly constant over time.
Therefore, the gas level of a mine can reliably serve as a proxy for its methane emissions per tonne of production, when direct measurements are unavailable.
Provincial shift
To estimate CMM emissions for each province in China, we assumed that the percentage of coal produced by mines of each gas level remains roughly constant as in 2011.
For instance, if 20% of Guizhou’s coal production in 2011 came from low-gas mines, we maintained this percentage for subsequent years.
We then calculated CMM emissions by multiplying provincial-level production-weighted emission factors by total coal production.
The line chart below illustrates our estimated CMM emissions since 2000.
The raw estimates, depicted by the lower grey dashed line, show a rapid increase in CMM emissions from approximately 5m tonnes in 2000 to nearly 21m tonnes in 2013.
This was followed by a decrease to 15m tonnes in 2016 and a subsequent rebound to 24m tonnes in 2023.
The decline between 2013 and 2016 aligns with a period of reduced coal production in China.
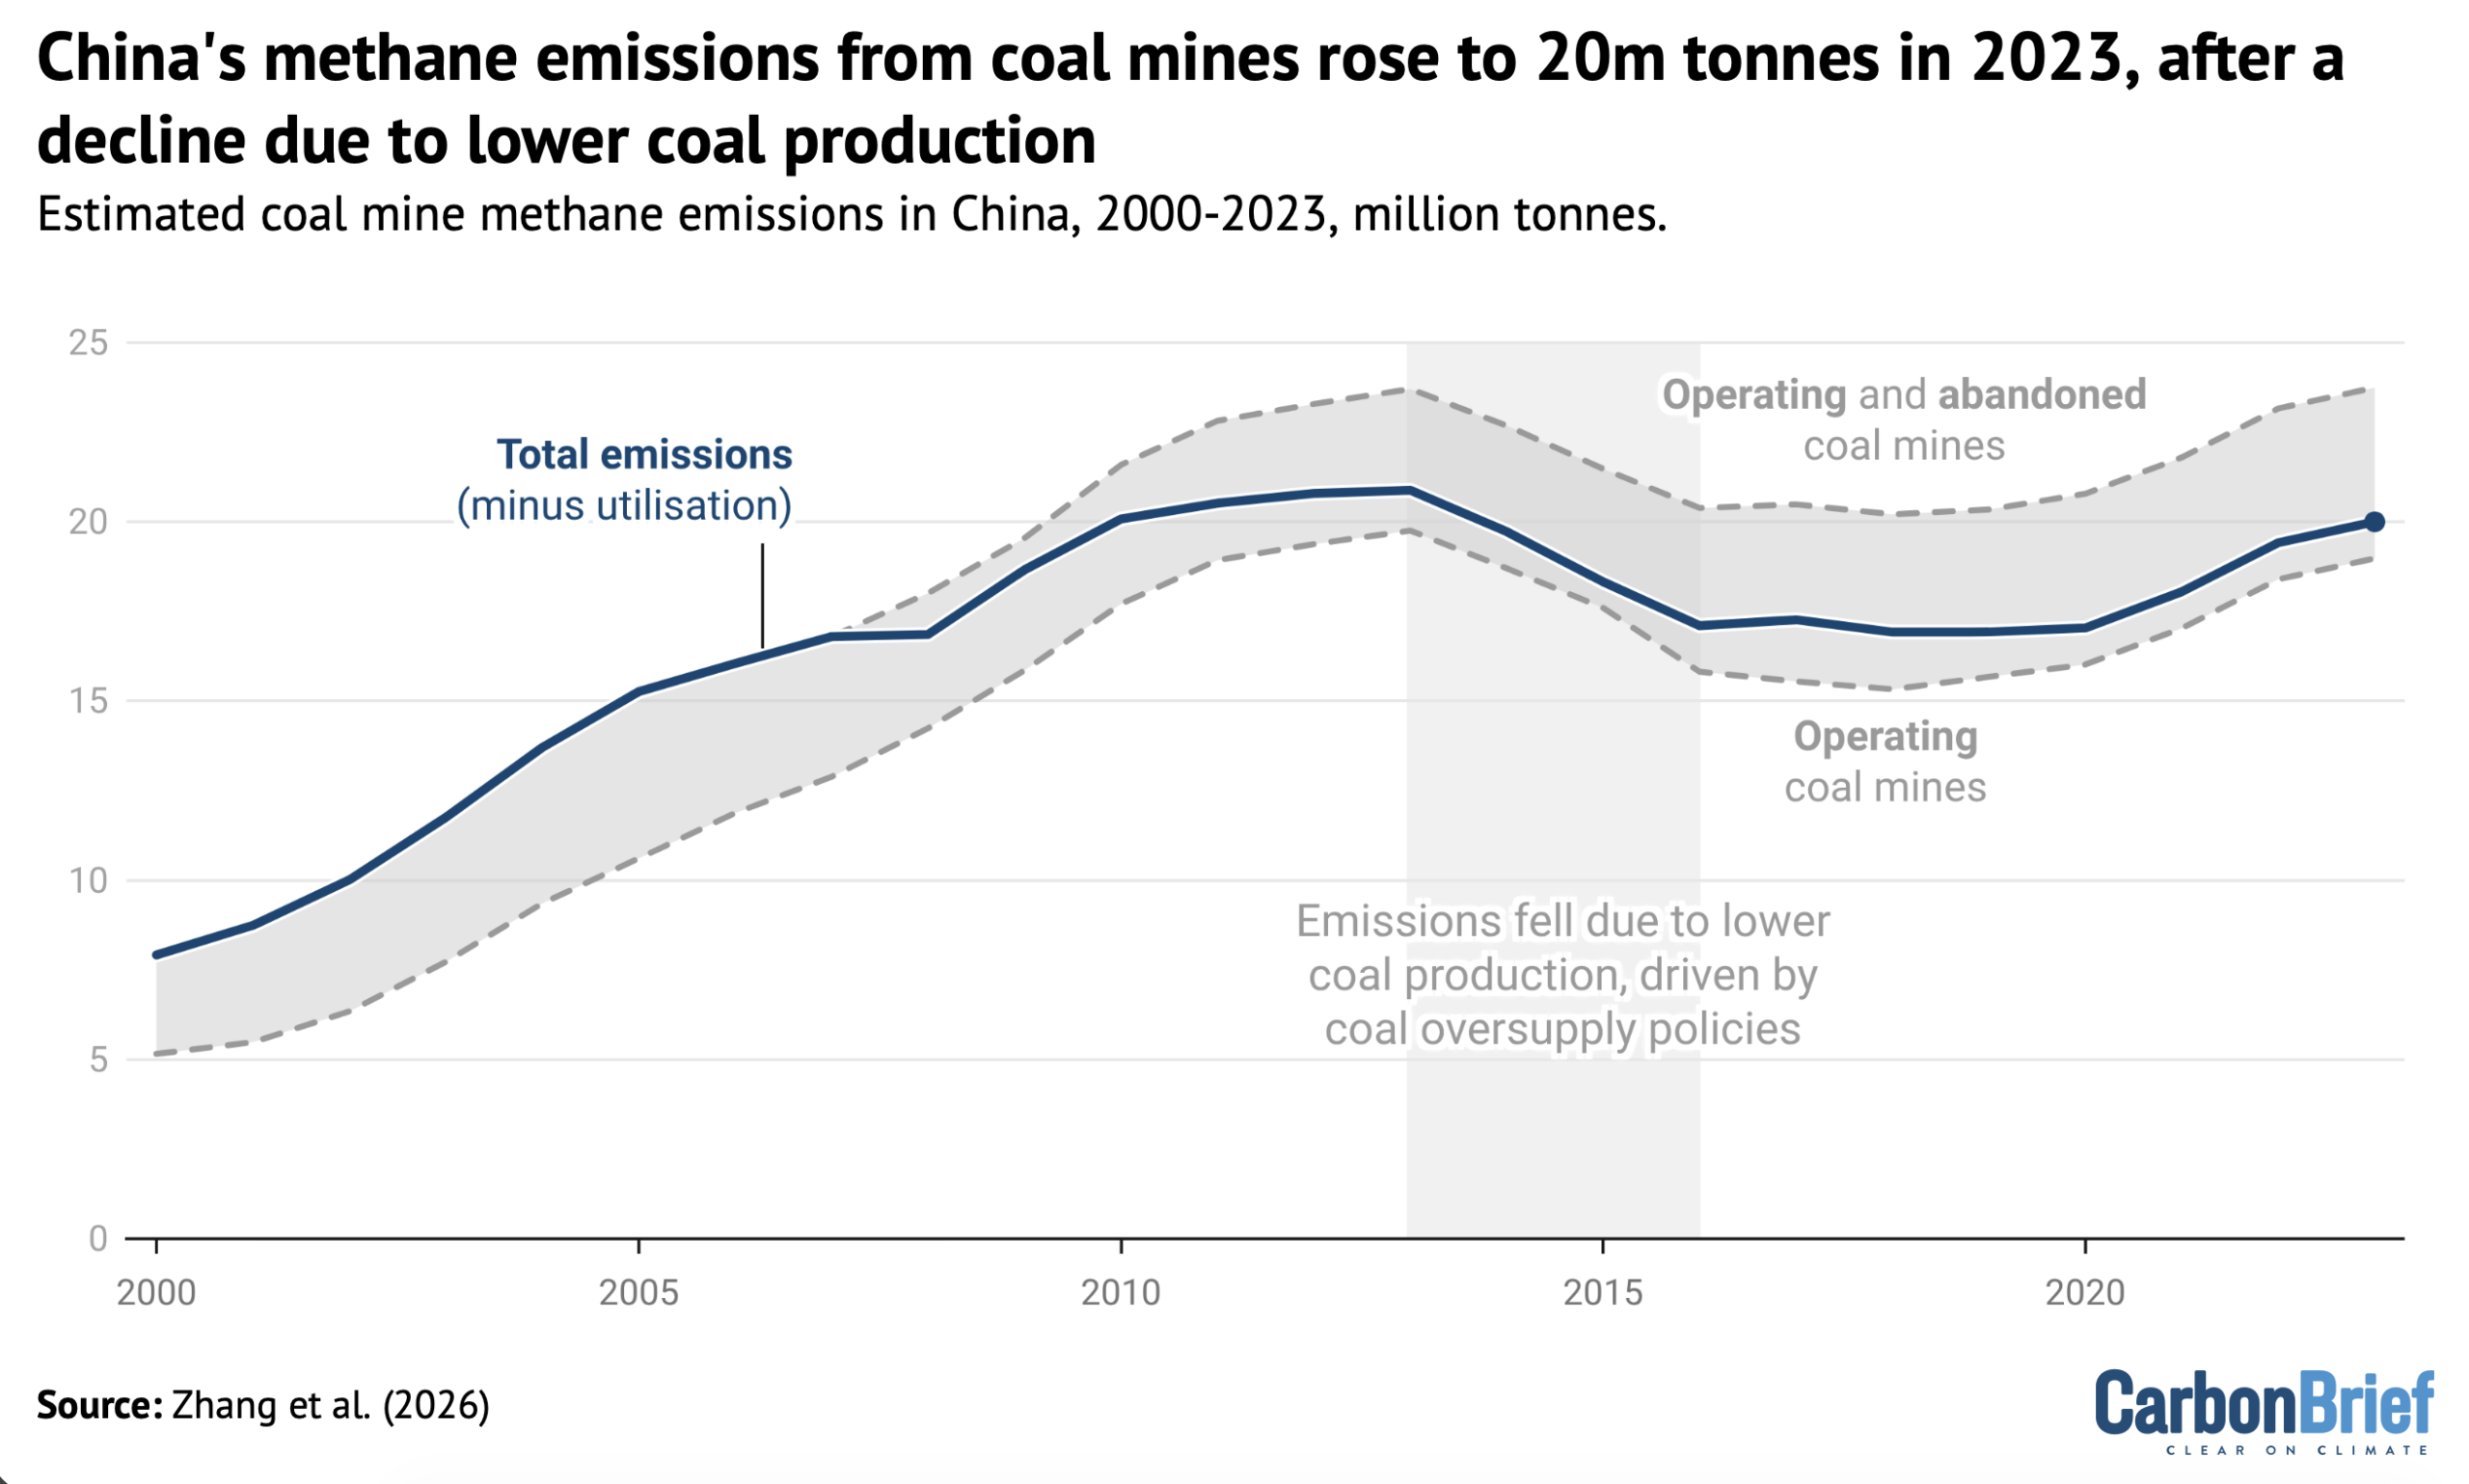
On the chart, the upper grey line represents CMM emissions when abandoned coal mines are included.
These mines, which continue to release methane long after operations cease, were responsible for 4.8m tonnes of methane emissions in 2020, contributing approximately 25% to the total CMM emissions.
Meanwhile, the blue line shows CMM emissions when the capture and use of methane in energy supply is taken into consideration.
National methane utilisation increased from 1.2m tonnes in 2008 to 3.7m tonnes in 2020, resulting in a reduction of total emissions by 5% and 17%, respectively.
It is noteworthy that CMM emissions did not immediately rebound after 2016, despite a reported increase in coal production by China’s National Bureau of Statistics.
This delay can likely be attributed to shifts in production locations to lower-emissions provinces, the closure of high-emissions mines and the adoption of technologies for capturing and using methane that effectively mitigate emissions.
The figure below compares CMM emissions across provinces in 2012 and 2021, two years with nearly identical total coal production levels.
Overall, changes in methane emissions closely mirrored shifts in where the coal was being mined. There is a clear geographic trend: production and emissions surged in northern and north-western regions such as Xinjiang, Shaanxi and especially Shanxi.
In fact, Shanxi alone emitted nearly 8m tonnes of coal-mine methane in 2021, making up roughly half of China’s total CMM emissions.
Meanwhile, both production and emissions dropped in south-western provinces, including Guizhou, Sichuan and Yunnan.
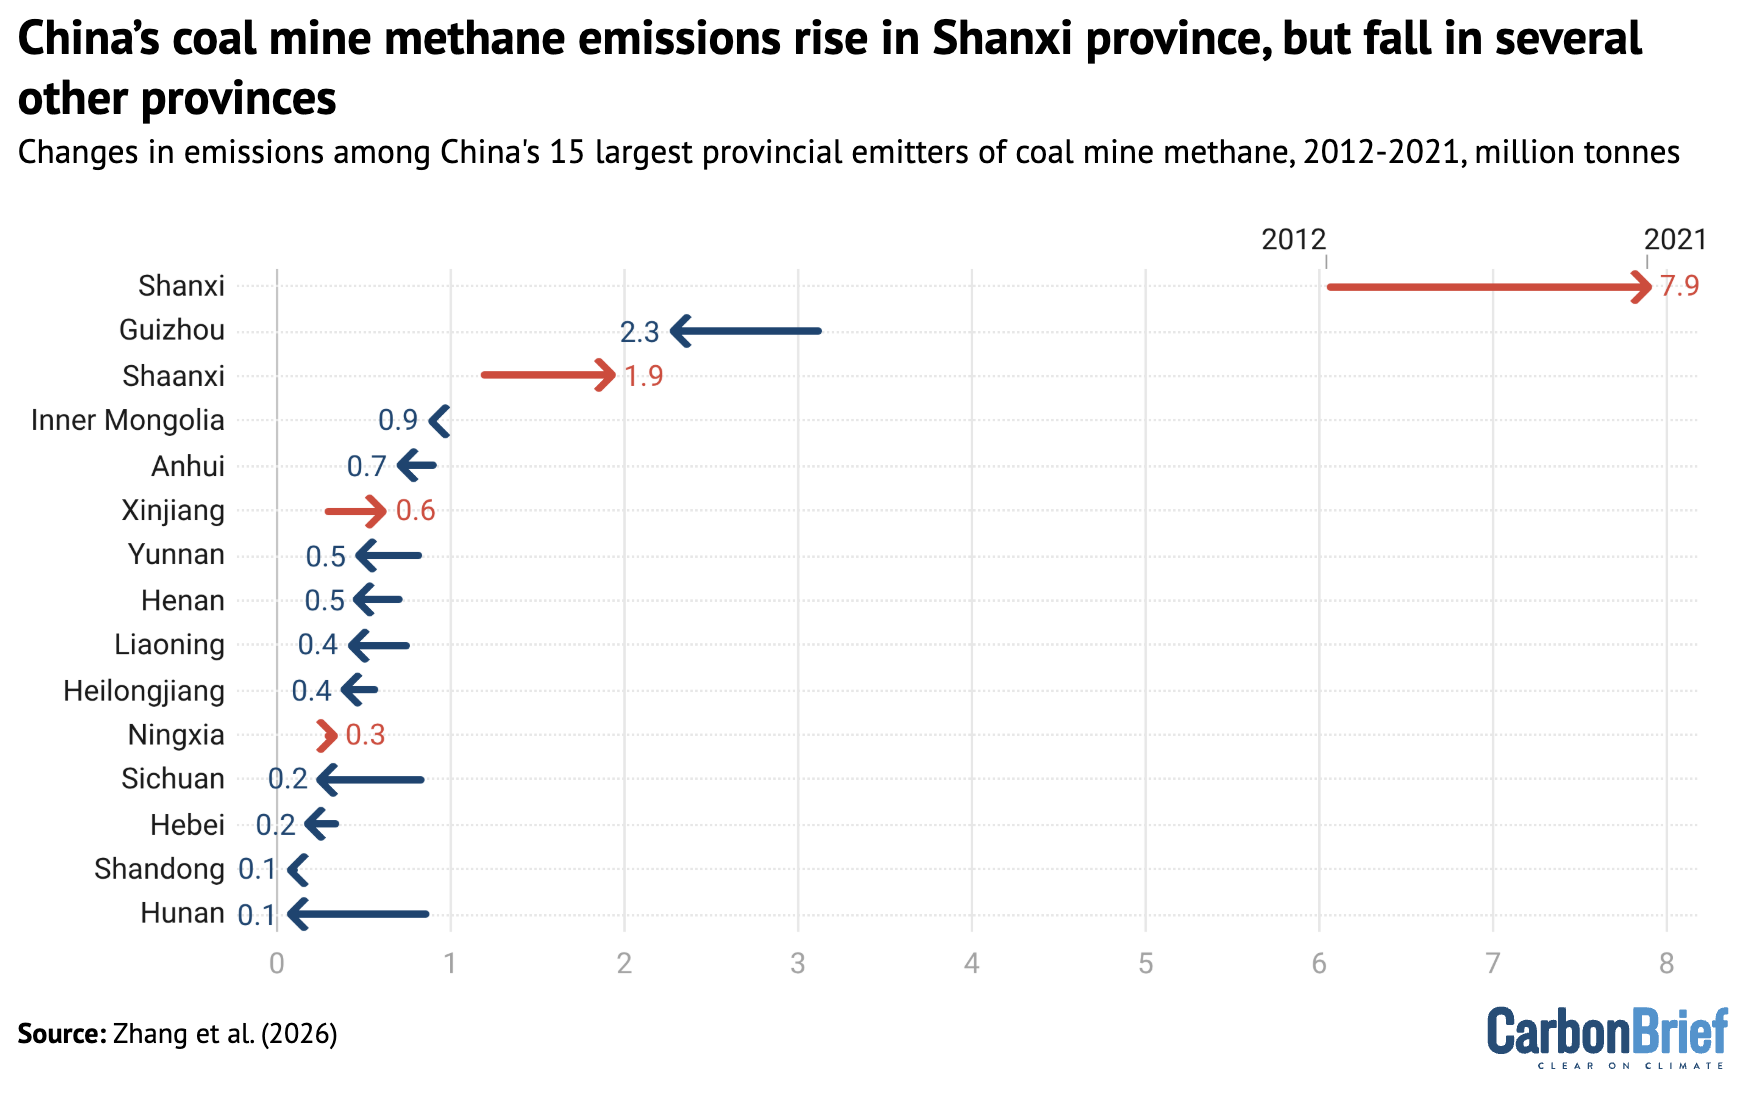
The figure shows that China’s coal production has switched from regions in the south-west where emissions per unit of coal production are relatively high, to lower-emission areas in the north and north-west. At the same time, total production levels have stayed similar, at just over 4bn tonnes in both 2012 and 2021.
Tackling methane
China has signalled its intention to address methane emissions, with key tasks for the next five years outlined in a national methane action plan published in 2023.
The broad trends of CMM emissions observed in this study will likely continue in China.
Small-scale coal mines – those producing less than 300,000 tonnes of coal per year – are at risk of closing or being consolidated, while increased production from large-scale, lower-emission mines in Xinjiang and Inner Mongolia will likely lead to an overall reduction in national production-weighted emission factors.
(This reduction in the rate of emissions per unit of coal production does not guarantee a reduction in methane emissions overall, as several analyses show this also depends on the total coal output. Even following closures, methane may still leak from abandoned mines.)
However, this regional shift in coal production – and, thus, methane emissions – could also help to address public health concerns from pollution associated with the gas.
The Chinese government has also introduced significant changes in policy on the capturing and use of methane gas. The Ministry of Ecology and Environment recently revised coal-mine methane standardsto mandate the capture and use of methane with concentrations above 8%, down from a previous 30%.
In addition, the government has a programme providing financial incentives for capturing methane and reducing CMM emissions.
Together, these measures could help China achieve its short- and medium-run methane capture and use goals set by the methane action plan.


Zhang et al. (2026) Regional production shift and increased utilization dampen the growth of China’s coal mine methane emissions, Communications Earth & Environment, https://doi.org/10.1038/s43247-025-02922-w.
Jie Zhang, Nina Khanna, and Jiang Lin contributed to the research.