Guest post: How China has reduced the carbon footprint of developed countries
We tend to remember the way things were, not the way things are.
In the 2000s, production-based CO2 emissions in developed countries declined while their carbon footprints grew. The carbon footprint – a measure of the total emissions attributable to the consumption of goods and services – includes the emissions to produce imported products, and excludes those to produce exports.
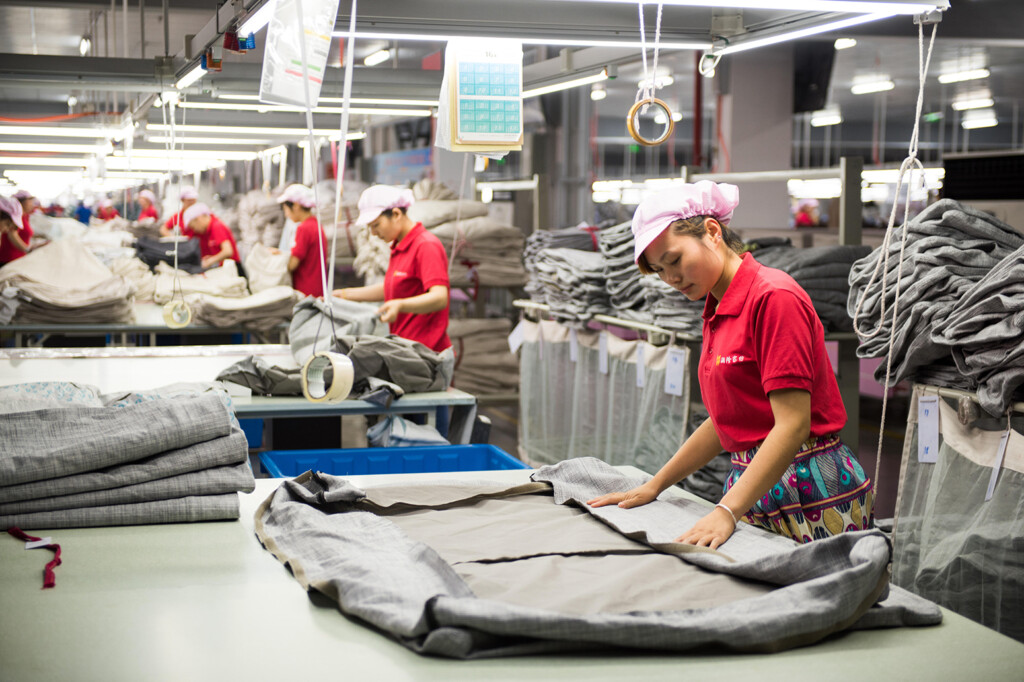
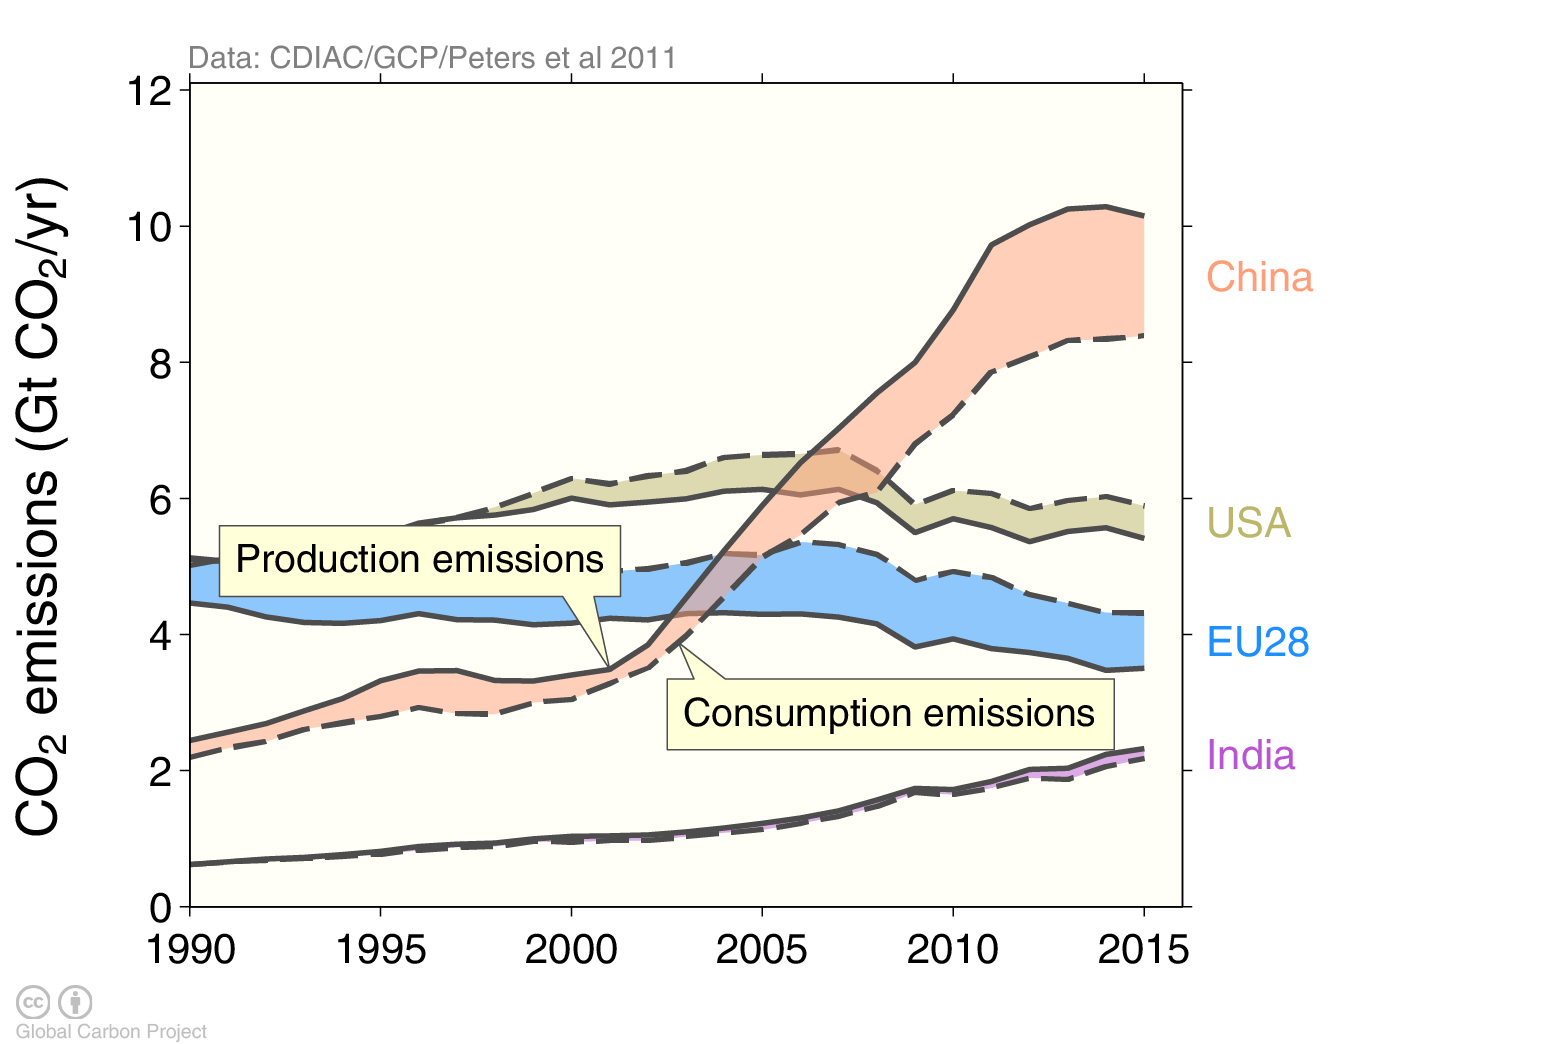
In essence, wealthy countries were producing fewer goods themselves and importing more from rapidly-developing nations, such as China and India. You can see how this affected production and consumption-based emissions in the chart below.
The rapid growth of carbon footprints in wealthy countries led to concerns about carbon leakage – where climate mitigation policies in one country lead to increases in CO2 emissions elsewhere – and industrial competitiveness, because international mitigation targets were slated to apply to developed countries and not the Global South. The US chose not to ratify the Kyoto Protocol using these arguments.
Many things have changed since the global financial crisis of 2007-2008, but changes in carbon footprints is one people often do not know about.
Global financial crisis
Since the global financial crisis, production-based emissions in the US and EU have declined, due in no small part to weaker economic growth. Declining emissions have also dragged down consumption-based emissions, a more formal name for the carbon footprint.

As the carbon footprint of one country depends on the emissions associated with the imports from another, the difference between production and consumption – and, by extension, imports and exports – is an important quantity. And, as we shall see, this is relevant for the effectiveness of domestic and international climate policy.
Chinese emissions stopped growing in 2013 – and so did the Chinese emissions from the production of its exported products. The slowdown in exported emissions from China tends to reduce carbon footprints in the US and EU, bringing production and consumption-based emissions closer together.
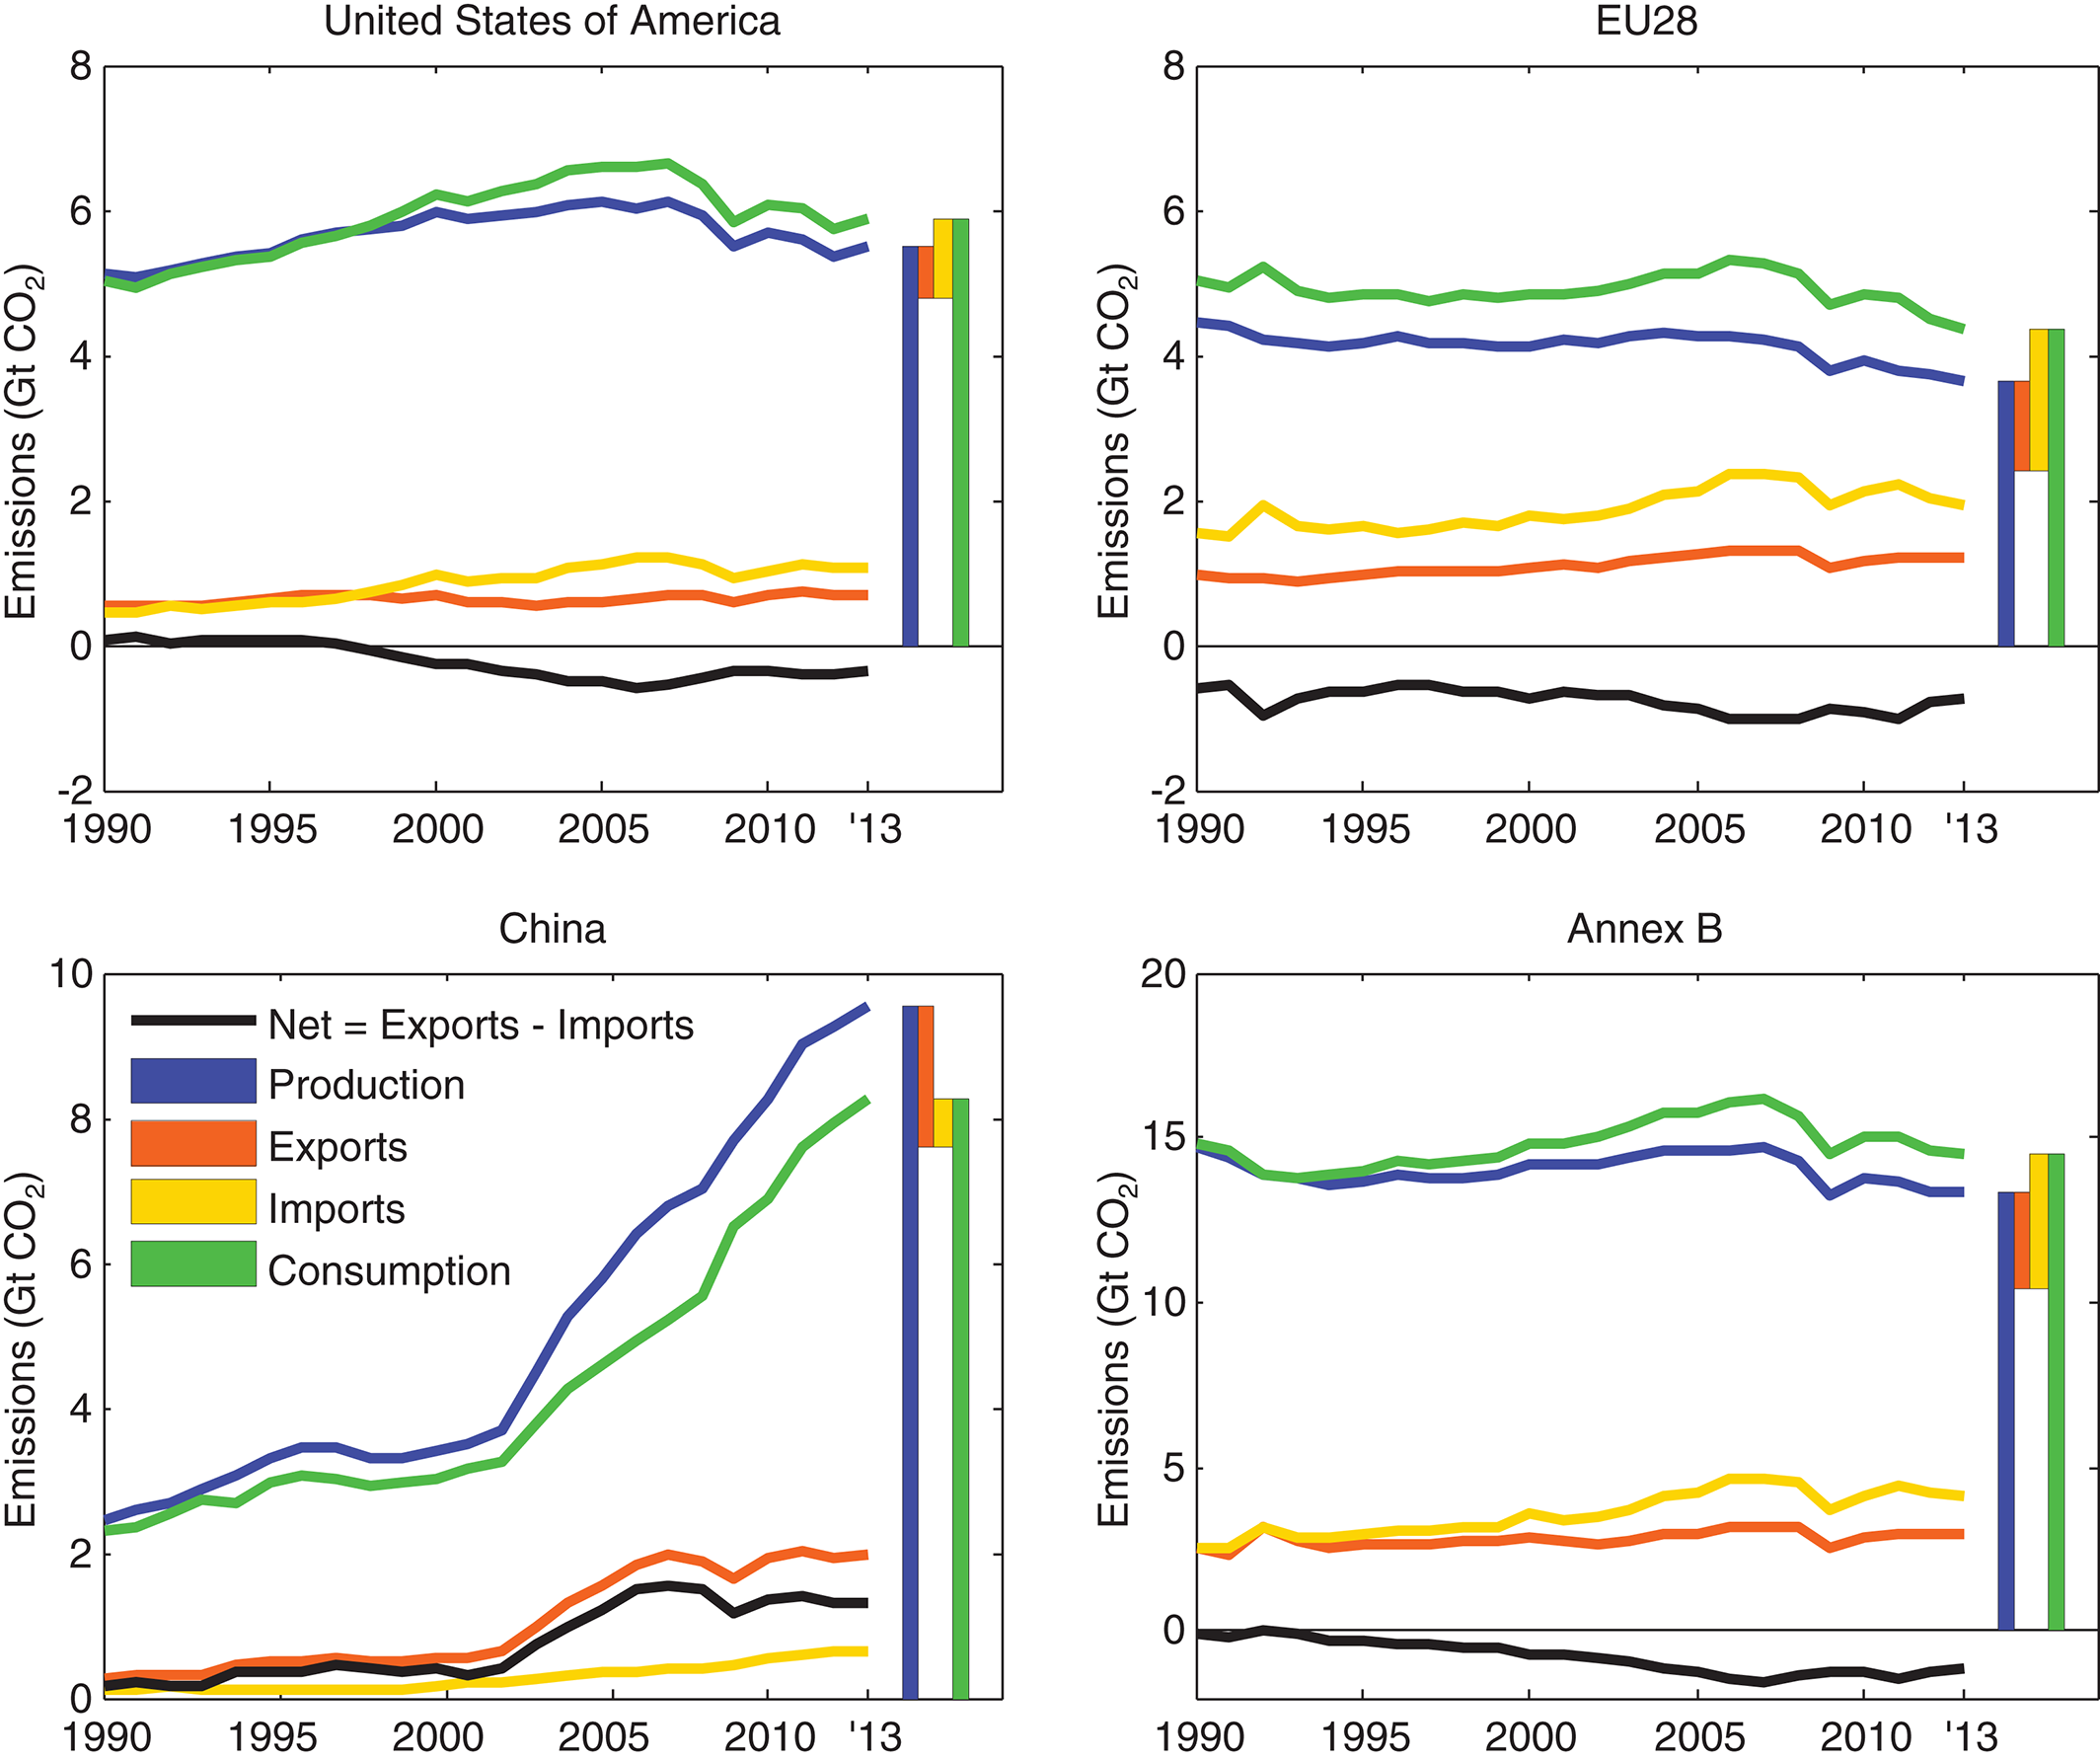
We have highlighted the trends in key countries and blocs below, followed by charts showing emissions from production (blue line), consumption (green), imports (yellow) and exports (orange).
US: Production-based emissions grew until about 2007, while exports remained flat. During this period, there was growth in imported emissions, and hence the gap between production and consumption grew. Since 2007, production-based emissions have declined, as have the imported emissions, leading to a reduction in consumption-based emissions and a closing of the gap between production and consumption.
European Union: EU emissions have been flat since 1990, but declined more rapidly since 2008. The EU has always been a net importer (since 1990), with a slight growth in exported emissions over the period. Imported emissions were high in the early 1990’s, but highly uncertain due to data complexities with the collapse of the Soviet Union. The imported emissions grew rapidly during the 2000’s, and then declined in the 2010’s. EU consumption emissions have declined since 2007, and the gap between production and consumption has reduced.
Annex B: In the context of international climate policy, it is worth looking at Annex B countries – those that had emission commitments in the Kyoto Protocol. The gap between production and consumption grew rapidly from 1990 to 2008, and explains the focus on climate policy in papers published around that time, as the growth in the gap between consumption and production more than offset emission reductions in Annex B countries. However, since 2008, the picture has changed completely, with the gap between production and consumption closing.
China: China has been a net exporter of emissions at least since 1990 and this net export increased rapidly in the 2000’s. This rapid increase suddenly stopped around 2007 and the specifics of this require deeper analysis.
China played a key role in growth and decline
Our recent study investigates the key role Chinese emissions have in the carbon footprints, primarily of developed countries (the EU, US, and Annex B as a whole).
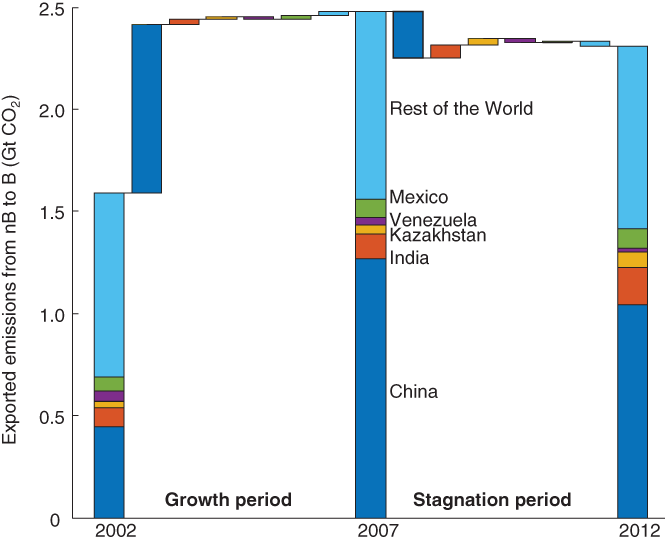
The chart below shows the growth in emissions from the production of exported products in developing countries, with the products consumed in developed countries. The figure is split into two time-periods based on data availability, the “growth period” just before the financial crisis (2002 to 2007) and the “stagnation period” during and after the crisis (2007 to 2012). The stacked bars in each year (2002, 2007, 2012) show the exported emissions, while the floating bars in between show the contributions to change over that same period.
During the growth period, the increase in imports into developed countries was driven entirely by China (large blue bar), with other countries making negligible contributions.
During the stagnation period, the plateau in the emissions imported into developed countries is, again, due entirely to China (blue bar).
The growth in consumption-based emissions in developed countries, and the associated policy discussions, was entirely a consequence of China. The recent changes in China probably have a much bigger effect on carbon footprints in the EU and US than any other factor. In effect, China has reduced our carbon footprint.
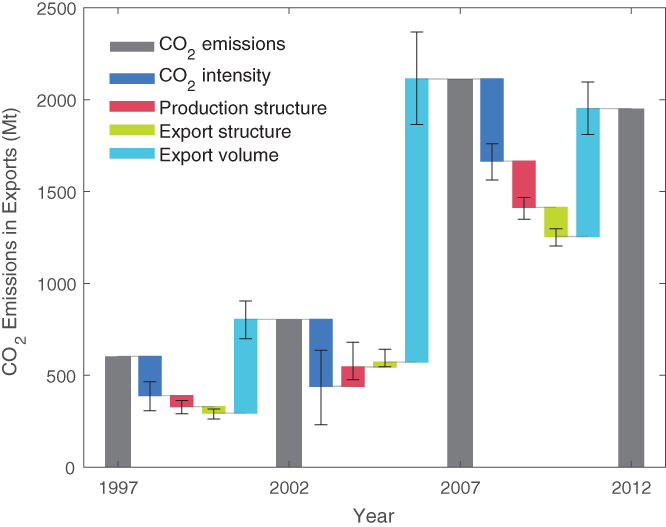
What has caused Chinese emissions to change so much? To answer that, we performed a “structural decomposition analysis” over the periods 1997-2002, 2002-2007, and 2007-2012.
A structural decomposition analysis decomposes the emission trends into key factors causing changes at the sector level. In the chart below we separate out the changes into the emission intensity (emissions per unit economic activity, dark blue), production structure (the relationship between industry sectors, pink), export structure (the mix of products exported, bright green) and export volume (the total amount of exports, light blue). The analysis is performed at the detailed sector level, but the chart only shows aggregated national results.
Overall, we found that the growth in export volume was the key factor pushing up Chinese exported emissions. Improvements in carbon intensity in China helped reduce the potential increase in emissions. In the stagnation period 2007-2012, structural changes in production and consumption also helped reduce the emissions, opposite to during the growth period 2002-2007.
The takeaway: The global financial crisis has led to weaker growth in export volumes, and China has implemented stronger climate policies, in combination leading to a decrease in the Chinese emissions from the production of exported products.
We also looked at the dominant cause of the changes at the sector level. A weaker global market after the global financial crisis led to drops in the amounts of steel, clothing and footwear produced in China, some of which has not returned to pre-crisis levels. China’s policies on value-added tax rebates may have amplified some of these changes.
Unrelated to the global financial crisis, Chinese policies led to a more rapid decarbonisation of the electricity sector. This not only includes renewables, but also including the adoption of state-of-the-art technologies for new coal power plants as well as construction of more hydropower.
Does this change the policy outlook?
Our findings have several important implications.
First, our analysis highlights the global interconnections between production and consumption. Many researchers have focused on how changes in our consumption could reduce emissions, a noble goal. But, because of global interconnections, helping China reduce its production emissions may be just as effective as domestic policies focusing on consumption.
Second, the threats of border carbon adjustments (putting carbon taxes on imported products, but removing them from exported products), often effectively aimed at China, held a lot of weight in the 2000’s, but since China has changed direction, those arguments are now weaker.
Third, China could play a critical role to help the world mitigate. China has a large production capacity, which could be directed to the production of environmental goods. We should encourage China to produce products to help decarbonise the world. The more wind, solar, and electric vehicles produced in China, the lower the costs and the greater the global diffusion.
Finally, China is taking great steps to restructure and clean up its economy. This should be actively encouraged as it both helps China reduce emissions and helps the world reduce its emissions through our ever-increasing consumption.
Article information
This guest post is based on the paper: Pan, C. et al. (2017) Emissions embodied in global trade have plateaued due to structural changes in China, Earth’s Future, doi:10.1002/2017EF000625