Guest post: How climate adaptation plans for European cities are gradually getting better
Multiple Authors
03.06.23The climate change adaptation plans of cities across Europe are getting better, but there is still a lot of progress to be made.
That is the headline conclusion of our new study, published in npj Nature Urban Sustainability, in which we assess the most recent adaptation plans of 167 European cities. In these plans, produced between 2005 and 2020, we find that the overall quality has improved.
Looking into different components of the plans, we find that cities have mostly improved in setting adaptation goals, suggesting thorough and varied adaptation measures and outlining their implementation. The Bulgarian capital Sofia and the Irish cities of Galway and Dublin score highest for their plans.
However, there has been only a slight improvement on how the implementation of city plans is monitored and on including civil society in plan making.
And while newer plans are slightly better at proposing measures that match the previously identified climate risks, the involvement of vulnerable people and the monitoring of adaptation measures that aim to support those people is still rare.
Here, we unpack the details of the clear positive trend in urban adaptation plans in Europe – and show that there is still a long way to go towards more inclusive and robust adaptation planning for climate risk reduction.
Adaptation planning
Adapting to the impacts of climate change formed a key part of the 2015 Paris Agreement, which stressed the need to review progress on adaptation, including through regular “global stocktakes”.
However, given that the effectiveness of many adaptation measures only really becomes apparent after some time – often only after a severe weather event has hit – it is notoriously difficult to assess this progress. Indeed, to date there is no agreement on the current state of adaptation, what “progress” means and how it should be assessed.
In our study, we examine the contents of adaptation plans to analyse the extent to which they identify climate risks and propose measures to reduce the scale of potential impacts.
To achieve this, we develop and apply three different indices to assess the quality of adaptation plans and apply them to 167 cities across Europe.
We find that these cities have improved in their abilities to plan for adaptation. These improvements may come about through processes of collective learning, knowledge transfer, capacity building, transnational networks and other types of science-policy collaborations.
However, most local governments are still not considering the needs of vulnerable people, nor involving them in policy formulation or monitoring whether adaptation measures reduce their vulnerability to climate threats. This is something that we regard as necessary for a good adaptation plan in order to make sure adaptation works for people most in need of it.
Evaluating progress
The impacts of climate change can be particularly pronounced in cities – many of which are highly vulnerable to heatwaves, flooding, coastal erosion and storms. This potentially puts a huge number of people at risk – around 40% of the population of Europe lives in cities, amounting to approximately 300 million people.
Therefore, we might expect that many city governments have set out how they seek to address these threats in official plans. These plans cannot tell the whole story in terms of actual progress in the collective reduction – or redistribution – of climate risks, because they do not tend to monitor implementation or the effectiveness of previous policies.
However, they can provide information about the quality and relevance of adaptation processes and actions, and help to assess the likelihood that cities’ advance adaptation goals by reducing risks and increasing resilience equitably.
As one previous study put it: “The best method [of] ensuring robust adaptation is to ensure rigorous adaptation planning processes.”
As such, developing and applying a set of indicators to measure and track the quality of urban adaptation plans can help us to learn collectively about how to deal with climate threats better.
We have incorporated our indicators into a free online tool to help city practitioners assess the quality of their own plans and benchmark their progress against others.
Defining urban adaptation planning quality
We assess adaptation plan quality according to six principles that are already well-established in previous studies:
- Evidence of impacts and risks in the local area.
- Adaptation goals.
- Adaptation measures.
- Details on the implementation of adaptation measures.
- Monitoring and evaluation of adaptation measures.
- Societal participation in plan creation.
In addition, we introduce a relatively new aspect concerning the “consistency” of the plans. Consistency means that impacts, risks, goals, measures, monitoring and participation are aligned with each other.
For example, if a city identifies that it is vulnerable to heatwaves, which puts older people at particular risk, then a good plan designs and implements specific heat-related measures that target older people, and puts mechanisms in place to assess whether their vulnerability to heat risks reduces after implementation.
Based on a combination of these six principles and various consistency measures, we develop a new “ADAptation plan Quality Assessment” (ADAQA) index. We then apply it to urban adaptation plans in a sample of 327 European cities that were published between 2005 and 2020.
Plan quality in European cities
The map below illustrates which European cities do (shown by hexagons) and do not (shown by grey dots) have adaptation plans. For cities that do have plans, the colour of the hexagon shows how recent it is, from before mid-2015 (yellow) to between mid-2015 and mid-2018 (blue) and then after mid-2018 (green). The size of the hexagon indicates the quality score of the plan, with larger hexagons signifying higher scores.
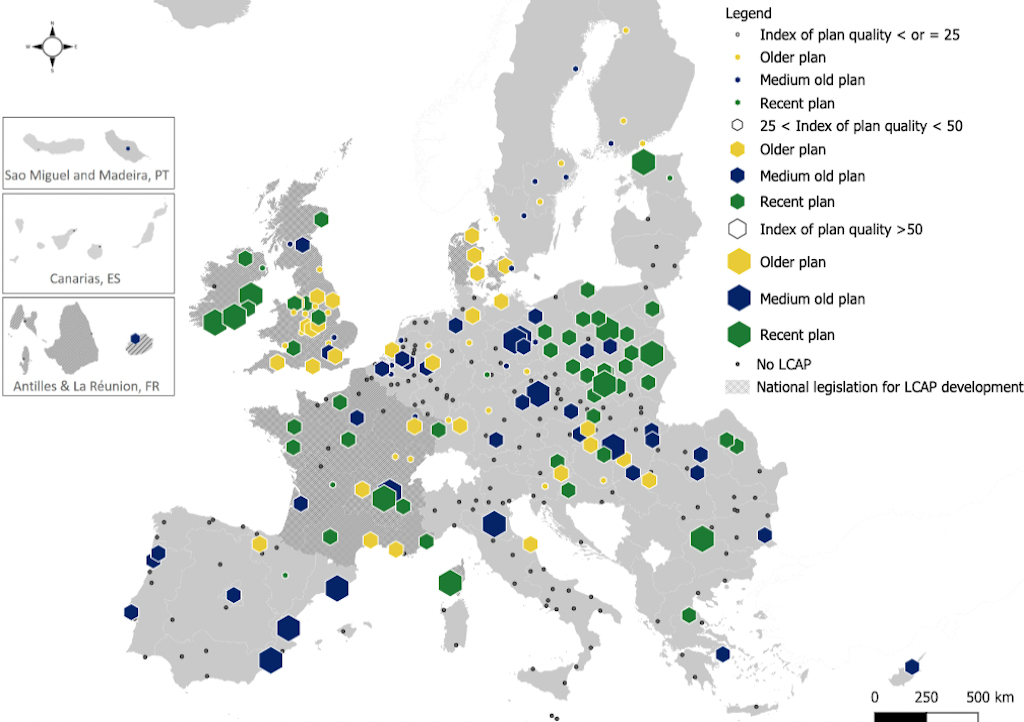
Of the whole sample, about 50% – 167 cities – have an adaptation plan. The largest numbers are found in the UK (30 plans), Poland and France (22 plans each) and Germany (19 plans).
A total of 53 of these 167 cities (32%) were developed under a national, regional or local law that requires municipalities (sometimes above a certain threshold of population size) to develop an urban climate adaptation plan. This is the case for cities in Denmark, Ireland, the UK and France.
The cities of Sofia in Bulgaria and Galway and Dublin in Ireland score highest in the adaptation plan index. Notably, the Irish government requires cities to produce adaptation plans that include certain features – such as an assessment of climate risks to the urban area – and this contributes towards their high scores.
Galway in particular achieves the highest score and performs particularly well on the first, fourth and sixth principles (impacts, implementation and participation, respectively) and also in terms of taking account of vulnerable sectors in its plan. The city has set clear priorities for different actions, identified responsible parties, set out a timeline for implementation and developed a detailed budget. Furthermore, it involved a wide range of stakeholders in the plan-making process.
Galway’s plan included a detailed risk assessment of how climate change threatens critical infrastructure, biodiversity, cultural capital, water resources and community services in the city. It then sets out a comprehensive action plan, which includes timescales and assigns responsibility to specific posts and teams within the municipality.
Specific initiatives include carrying out climate risk assessments of all council buildings and infrastructure (such as roads), integrating adaptation into planning decisions (such as by restricting development near coastal erosion zones), upgrading stormwater drainage systems and planting trees. The city is also running campaigns to inform the public about how they can reduce their exposure to climate risks and to raise awareness amongst businesses about the funding that is available to help with adaptation. Galway is committed to regular monitoring of climate impacts and reviewing its policies accordingly, and producing annual reports that evaluate how it is implementing the plan.
For its part, the city of Sofia focuses more on improving blue-green infrastructure (such as grey water recycling), improving surface water management, acquiring additional land to increase the amount of green space, planting a new forest on deserted council-owned property and upgrading water supply and sewerage systems.
In contrast, Lincoln in the UK had the oldest plan in our sample and – perhaps unsurprisingly – achieved a much lower score. Lincoln’s plan was approved by the municipality in 2005, but had not been updated before our cut-off date at the end of 2020. Although Lincoln was ahead of most other cities at that time (its plan sets out ideas for combatting various climate threats), it does not consider the specific needs of vulnerable groups, nor set out clear goals, timelines or priorities for action.
Evolution of plan quality over time
As the chart below highlights, we find that the quality of city adaptation plans has shown a small improvement over time. On a linear basis (dotted line), plan quality has increased by about 1.3 points per year from 2005 to 2020.
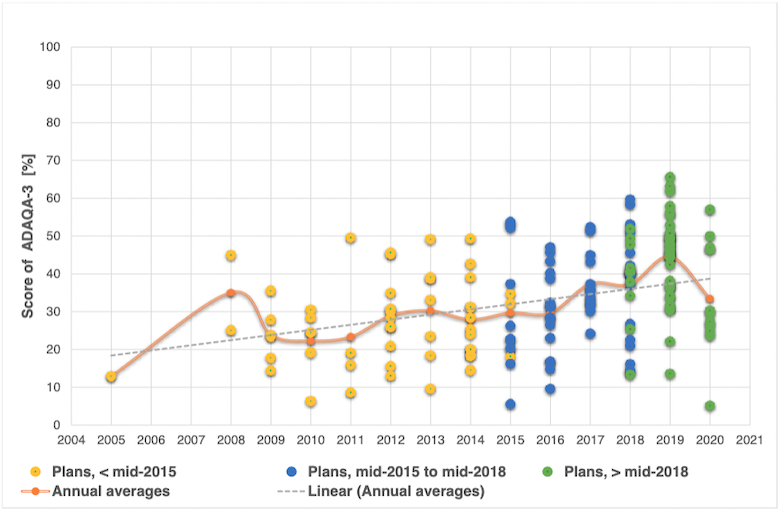
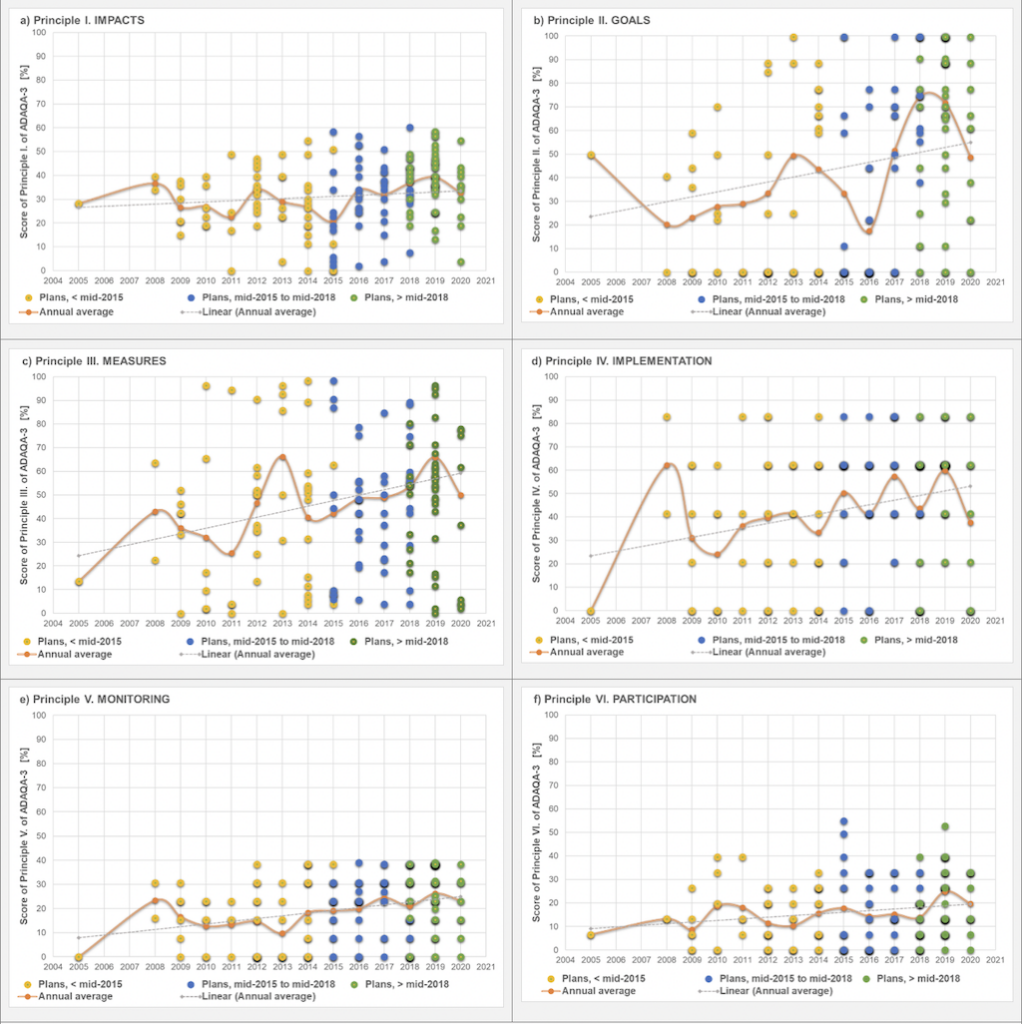
Despite this progress, we find clear differences in terms of the various principles of plan quality.
This is shown in more detail in the charts below, which unpack the quality scores into each of the six principles individually.
On average, cities improved most in terms of goal setting (second principle) – suggesting detailed and different measures – and setting out the implementation approach (fourth principle). The plans improved only slightly with regard to monitoring (fifth principle) – that is, the progress of implementing the measures – and participation (sixth principle), such as including civil society in plan making.
Consistency of plans over time
As mentioned, one of the central characteristics of our index is its focus on consistency between identified climate risks and the measures that the city plans and monitors.
We find that the consistency improved slightly over time, particularly with regards to aligning risks with adaptation goals and vulnerable industries with adaptation measures.
The risks for vulnerable groups and how these groups were involved in plan development, as well as how adaptation measures for vulnerable groups were monitored over time, were also better aligned in later plans.
However, the overall number of cities that engage vulnerable people in developing plans and monitor the impact of adaptation measures on these at-risk groups remains very low.
In other words, vulnerable groups – such as older people and those on low incomes – are rarely involved in participation processes and the vast majority of plans make no mention of monitoring and evaluation to address their specific needs.
Moreover, urban adaptation plans got worse over time setting out measures that particularly address these vulnerable groups. That means, more recent plans involve fewer measures that particularly address identified vulnerable groups.
Overall, although the quality of urban adaptation plans in Europe has improved since 2005, many cities are still lagging behind or are yet to even produce a plan.
Furthermore, most of the existing plans do not sufficiently take account of the specific needs of those people who are particularly vulnerable to climate impacts.
We hope that our study – and the accompanying online tool – can help practitioners and policymakers reflect on what they can include in future plans, and thereby contribute towards improved resilience in cities across Europe and elsewhere.


Reckien, D. et al. (2023) Assessing the quality of urban climate adaptation plans over time, npj Nature Urban Sustainability, doi:10.1038/s42949-023-00085-1
-
Guest post: How climate adaptation plans for European cities are gradually getting better