Guest post: How climate change is driving forest loss in India
India is home to 650 endemic tree species found nowhere else in the world, 8% of the world’s biodiversity and three biodiversity hotspots. The majority of this unique flora and fauna can be found in India’s forests.
These forests provide important services in the form of absorbing carbon, preserving nutrients and providing timber and fuelwood. However, deforestation is not only causing loss of these services, but is also affecting the climate of India as well as places further afield.
The most common cause of forest loss in the tropics is commodity-driven deforestation. However, a growing body of research has shown that climate change is affecting the survival and composition of tropical forests.
How global warming is changing the forests of India has so far been largely overlooked. And while some exciting research is emerging on the effects of future climate change on forest distribution, we are still lacking information on how it is currently impacting forests.
In India, many studies have documented the forest loss in the early 2000s, but very few have assessed it on a large scale since. And the primary data source – the Forest Survey of India – lacks information on the location of deforestation and total forest loss.
In our study, published in Global Change Biology, we take a step towards closing these gaps by mapping forest loss and climate change across the country between 2001 and 2018.
We find that forest loss increased substantially this century, with the majority occurring in the north-east region. We also show that climate change is playing an important role in India’s forest loss – but it will likely remain secondary to other factors in the near future.
Updating knowledge on forest loss
Our first task was to map forest cover and forest loss across India. Due to the lack of free open-access national datasets on forest change, we used a global forest dataset.
The maps below show forest cover in 2000 (left) and forest loss between 2001 and 2018 (right) by district. The darker shading indicates areas of greater cover (green in left-hand map) and loss (purple in right-hand map).
We found that there is still an extensive amount of forest loss occurring in India, totalling 20,472 square kilometres (km2) of loss between 2001 and 2018, accounting for more than 7% of India’s forest cover.
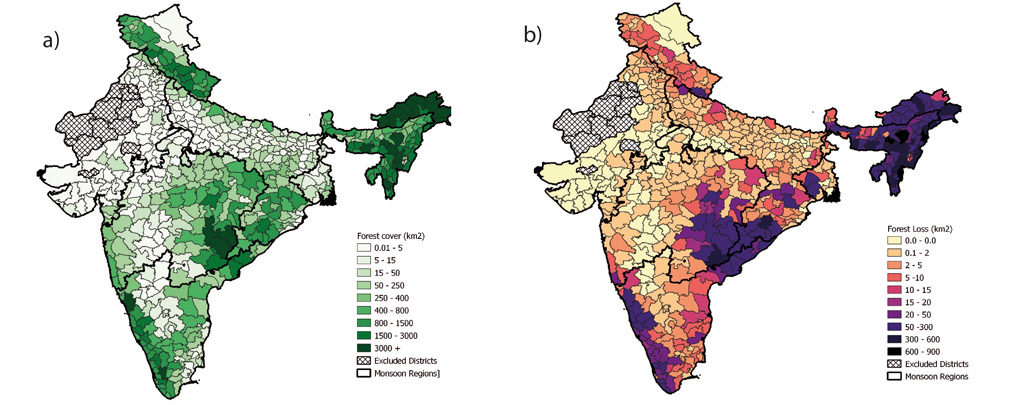
Certain areas of the country support higher levels of forest cover than others – likely due to a combination of environmental and topographic conditions, human pressures and accessibility. Subsequently, these high forest cover areas also tended to be the areas where there were the highest forest losses – as there was more forest to be lost.
We identified three key areas of high forest loss, which you can see as collections of purple districts on the right-hand map. The Western Ghats (parallel to the western coast of the Indian peninsula) and north-east regions (the easternmost part of India) are biodiversity hotspots and harbour endemic bird areas. The eastern central region is a key habitat for elephant populations, and harbours 13% of India’s flowering plant species.
Mapping climate change in areas of forest loss
We wanted to capture two metrics of climate change. The first was a change over time, known as a “temporal trend”, and we calculated the change in rainfall in mm per year and the change in temperature in degrees celsius per year.
But change over time is not the only important factor when we consider the impacts of a warming world. We also need to consider the surrounding conditions – for example, there are some instances where an increase in temperature could cause an organism to die out, but other instances that can be avoidable by species movement.
As such, the proximity of cooler areas could impact the chances of survival. These nuances cannot be measured by our typical temporal trends, so instead we use a metric called “climate velocity”.
The maps below show these two types of metric, including temporal trends in rainfall (top-left) and temperature (top-right), and climate velocities for rainfall (bottom-left) and temperature (bottom-right) for 2001-18. Darker colours indicate a greater change – warmer/wetter (orange) and cooler/drier (purple) – over time or speed of velocity.
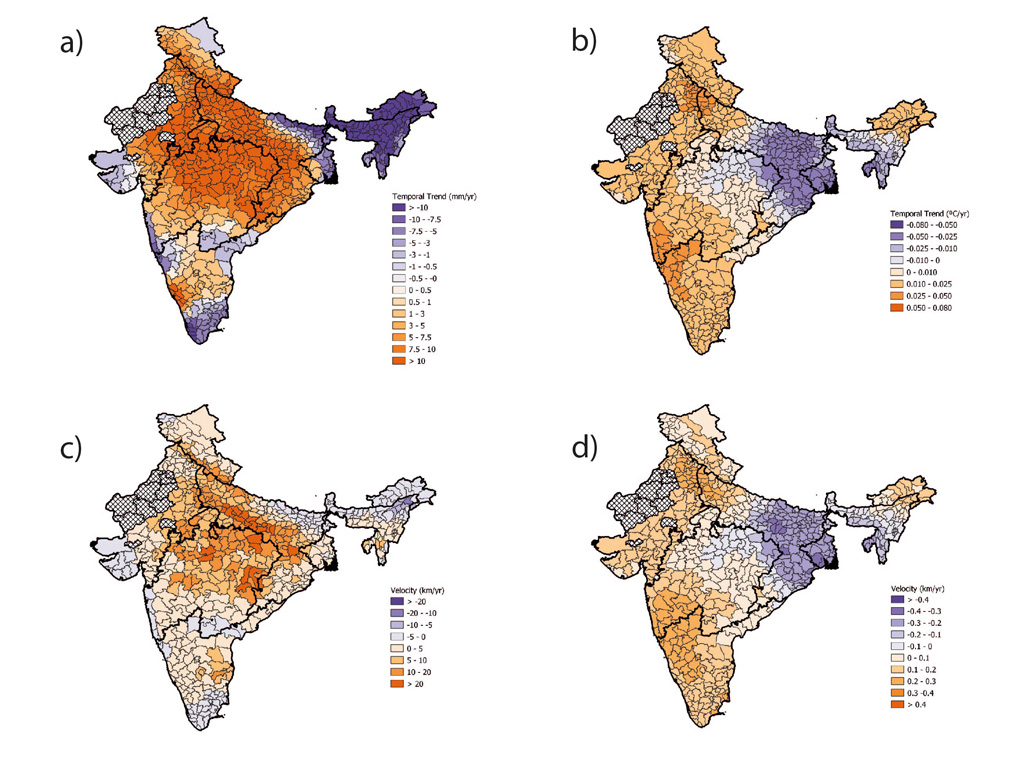
The maps highlight that India’s central areas are getting wetter, and that the majority of the country is getting warmer. Climate velocities are quite high in some areas, indicating that species here may have to move up to 20km per year to retain the current conditions. In addition, many eastern and southern areas of the country are experiencing drying conditions that could potentially lead to drought – a key risk factor for tropical trees.
What does this mean for forests?
These maps show that areas with high forest cover are experiencing a lot of different trends in climate change. Most are getting warmer and drier, but some – such as the north-east – are getting cooler.
While mapping climate across India, we noticed that when we broke down the data into seasons, many of the seasons had opposing trends. We quickly came to the realisation that if we wanted to understand how forests are impacted by climate change, we needed to take into account the high level of variation between seasons.
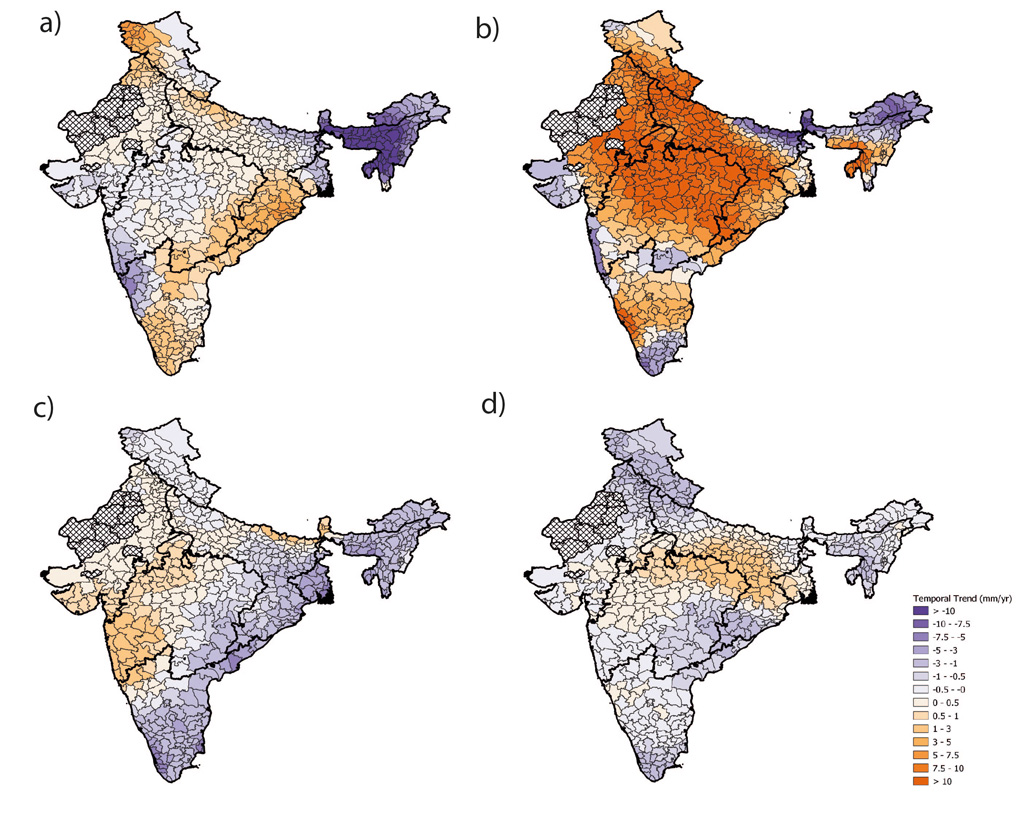
You can see some of this variation in the maps below which show the trends in rainfall change between the four seasons. It is clear that the trend of increasing rainfall during the monsoon season (top-right) strongly diverges from the other seasons around it.
To assess whether there was correlation between these climate changes and forest loss in India, we developed some statistical models. These models showed that most forest loss was occurring in areas where there were rainfall decreases and faster velocities of rainfall. This is not surprising due to the susceptibility of tropical trees to drought.
Relationships with temperature were more complex and, surprisingly, it was not the fastest warming areas where the greatest forest loss was occurring. Instead it was the areas with the slowest increases – and cooling in some seasons.
More information is needed to be able to understand why we found these trends, but it could be related to an unusual cooling patch found in the north-east, first documented by a Nature study in 2018, which coincides with an area of high forest loss.
This is concerning as we do not fully understand how tropical trees might respond to cooling, and because all of our projections indicate warming to occur here in the future.
We also found that all three of the key hotpots for forest loss show high climate velocities – in the top 10% of values – at some point during the year, and thus may be more at risk due to the speed of climate change.
In particular, the northern Western Ghats region showed a concerning trend for rapid warming and drying, a highly detrimental combination for tropical trees. The area is important for flora and fauna, with seven protected areas and a biodiversity hotspot, alongside already high levels of human exploitation and encroachment which could lead to a double threat for forests here.
Our results highlight the complexity of climate changes occurring in India’s forests. However, what we have found is that some of the areas of highest forest cover – which are vital for India’s biodiversity – are experiencing concerning speeds of climate change, and a general drying trend. This could threaten their long-term survival, as well as the continued presence of the species – and human populations – that rely on them.
Closing future knowledge gaps
It is important to note that it may be unlikely that tree cover will have to move 20km a year, for example, to keep up with specific rainfall conditions. This is an average for a district so there may be areas of the district that are more suitable and can act as refuges. Species also may be able to cope with, or adapt to, changes in rainfall and temperature.
However, these maps of climate velocity do provide useful insight into where species may be more at risk.
We can use this in conservation planning to ensure our protected areas are in the most effective places to preserve both vulnerable locations and provide refuge in more climatically suitable locations. We can also use this information to build corridors between places of high velocity and low velocity, facilitating species movement, so these findings have positive implications for conservation as well as continuing the stark warming that climate change is happening.
This research highlights that in order to conserve Indian forests and biodiversity we need to be considering the role climate change is having on forest survival and distribution.
India is in the process of creating a new National Forest Policy to replace the last, which was written in 1988. Therefore, this is a crucial time for policies to be considering the multiple threats that forests in the country face. Adaptable management strategies built from up-to-date research is even more important as the country’s forests face unprecedented threats on multiple fronts.
It may be a cliché, but with knowledge comes power. Knowing where species may encounter faster changes in climate or be more exposed to climate change can help us to protect the most vulnerable areas and to find climate refuges for species. Once we identify these areas we can work on creating solutions to support species adapting or build corridors to help species move with climate change.
Article information
Haughan, A. E. et al. (2022) Determining the role of climate change in India’s past forest loss, Global Change Biology, doi:10.1111/gcb.16161.