Guest post: In conflict and peace, what drives deforestation in Colombia?

Guest authors
03.09.22Guest authors
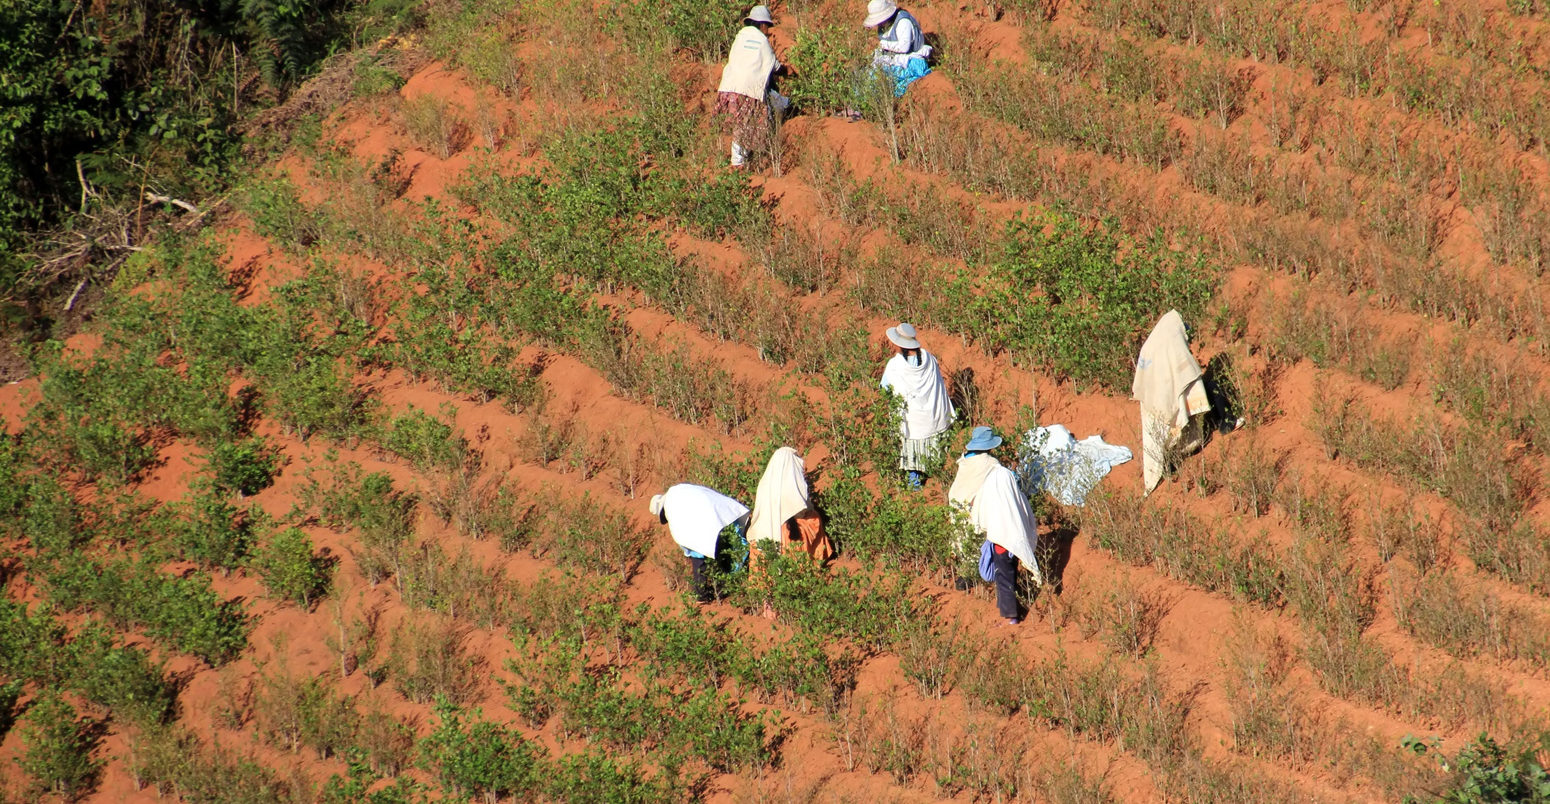
09.03.2022 | 1:54pmIn 2016, the government of Colombia signed a landmark peace accord with former guerilla group the Revolutionary Armed Forces of Colombia (FARC), bringing a formal end to a 50-year-long armed conflict.
As a tentative peace settled over the country, researchers and conservationists were concerned about what it would mean for Colombia’s forests.
Several studies have found that deforestation in the country has increased in the years since the accord was signed. Their findings have often become the cornerstone of interventions for addressing deforestation in areas affected by conflict. But many of these past studies on the relationship between deforestation and armed conflict in Colombia tend to draw their conclusions based on what is happening at the regional and departmental levels (departments are equivalent to states in the US).
Today, deforestation continues to beset Colombia’s conflict-affected areas, despite attempts to incorporate environmental conservation into peacebuilding activities. This suggests that our understanding of the complexities linking deforestation with conflict is inadequate for informing policy. In turn, this points to a need to look deeper – and at a more localised level – into why trees are cleared during periods of conflict as well as during times of peace.
In our recent study, published in Frontiers in Environmental Science, we explore these deforestation-conflict dynamics at a finer scale. Building on previous analyses, we assess the reasons behind forest cover loss at different scales. We do so by grouping local districts (known as “municipalities” in Colombia) according to their trends in deforestation and relating these trends to potential causes or “drivers”.
Our analysis finds that trends and causes of deforestation at a local level are as diverse as the trends seen at regional and departmental scales. We observe that in some areas, peace has not significantly changed the patterns of deforestation. In other places, deforestation has been exacerbated in the years since the agreement was signed.
We also find that the main drivers of deforestation are cattle rearing and coca cultivation, while the size of a municipality is also a strong factor.
Assessing conflict-forest loss dynamics
To understand conflict-forest loss dynamics in Colombia, we employed three methods.
First, using available global data sets on forest cover loss, we calculated the area of forest cover loss at the municipality level over 2001-18. The study period covers the years both before and after the peace accord was signed. Although negotiations began in 2012, the final peace agreement was not signed until 2016.
Drawing on previous studies of what drives deforestation in Colombia, we focused on a selection of potential causes, including violent conflict events, the number of displaced people, the cultivation of coca (the raw ingredient for the drug cocaine), cattle farming (both number of individual cattle and number of cattle farms) and municipality area.
Armed groups use forests in different strategic ways, such as to conceal their operations, to hideout or to undertake money-making activities such as coca cultivation. Their presence in forests can be related to the number of conflict events and displaced people – those forced out of their homes due to conflict – which in turn are related to deforestation in different ways. By looking at these variables, we have an idea of where armed groups were during the conflict and how this may relate to deforestation before and after the peace agreement.
Meanwhile, coca cultivation and cattle rearing are both thought to be major causes of deforestation in conflict-affected areas. The former indicates areas used for money-making activities, while the number of cattle farms and displaced people may indicate areas where groups have expanded their territorial control and accumulated land assets.
The assumption behind municipality area as a cause of deforestation is that the bigger the area of the municipality, the lesser the institutional presence. This follows from arguments (pdf) that deficient governance and weak institutional presence are major underlying causes of deforestation.
Second, we carried out what is known as a “timeseries clustering analysis.” This method is meant to identify the typical dynamics of forest cover losses across Colombian municipalities and across time during the study period. We used the shared deforestation dynamics to cluster the municipalities into a set of seven categories according to their similarity, which we labelled from A to G.
Third, we conducted a statistical analysis to assess the significance of each potential driver in determining observed patterns of forest cover loss. We did this analysis at several scales: for the whole country, five natural regions, 29 departments and the seven municipality categories we defined above.
Clustered municipalities
We found that, of the 1,121 mainland Colombian municipalities, 708 account for 98% of total deforestation nationally. We were then able to group these 708 mainland municipalities into the seven categories mentioned above.
The figure below depicts the fluctuating patterns of forest cover loss among the clustered municipalities during the study period. The upward deforestation trend in most categories – that is, all except F – during the final years of the study period suggests that the peace accord has had ramifications for the preservation of tropical forest areas in Colombia. However, such an effect is explained by diverse factors.
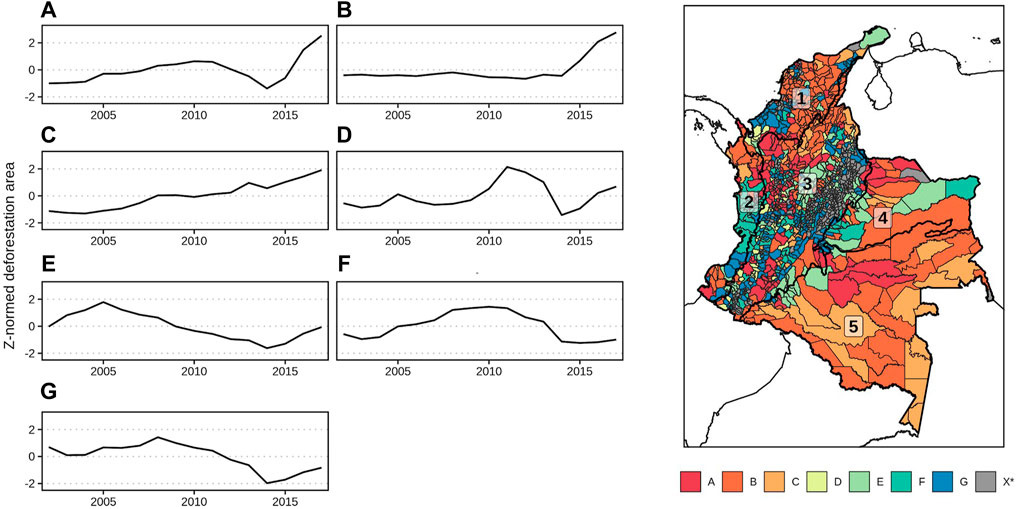
When we rank the categories of municipalities according to the percentage of total deforestation during the study period, category B is the highest, followed by categories A, C, E and G. We found the lowest percentages of total deforestation for 2001-18 in municipalities under categories D and F.
When we plot the clustered municipalities with the highest percentage of total deforestation in Colombia during the study period, we find that most of them are in the Amazon and the Andes. Deforestation in these two regions accounts for 75% of the national aggregate over 2001-18, even though the two regions cover just 34% of the country’s mainland municipalities.
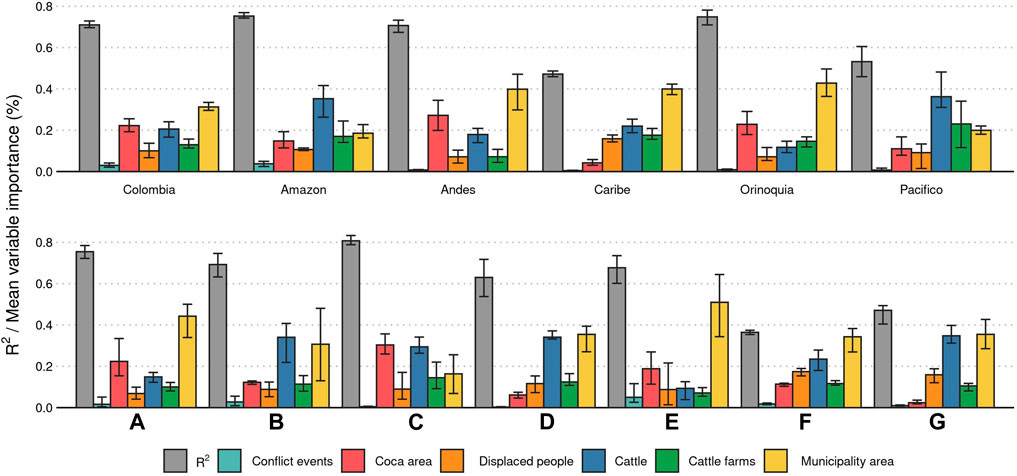
When it comes to the importance of different factors for forest cover loss across the national, regional and municipality category levels, there are several similarities. Across all three scales, the number of conflict events was the least significant factor. Coca cultivation, number of cattle and municipality area were the most prominent factors for forest cover loss at every level we studied.
However, when we delve deeper, we find more nuanced differences between clustered municipalities, departments and regions, especially regarding the degree of importance of the different factors.
For instance, municipal area constitutes the strongest predictor variable for forest cover change in municipalities under category A, but it is only the second strongest in municipalities under category B, where the strongest predictor variable is cattle.
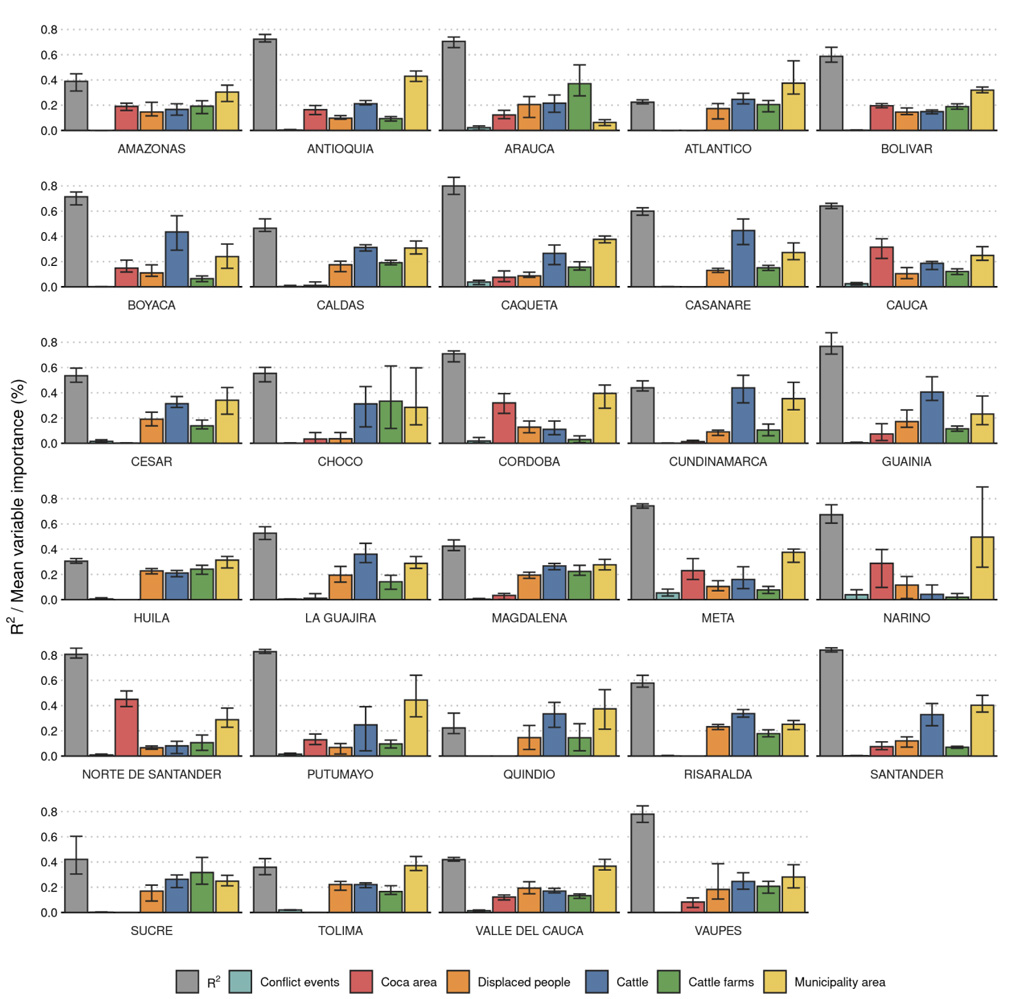
Similarly, while cattle is the strongest factor in the Amazon, municipal area is the strongest in the Andes. These factors differ between departments too. For example, in one such as Arauca, the number of cattle farms is the most important factor, while in another, such as Norte de Santander, it is coca cultivation that best correlates with deforestation.
The figures below show how the strength of the different factors changes between natural regions (top row), clustered municipalities (second row) and departments (second figure). The colours indicate the overall level of importance from the variables (grey) and the contribution of each variable.
A context-specific approach
What our study suggests is that to get a fuller picture of the effects of conflict on forest-cover loss in Colombia, one must go as local as one can. This means understanding the context not just at the regional and departmental levels, but also at the municipal level and, if possible, at an even smaller scale.
This suggestion can also apply to countries that experience a similar predicament. In many other countries, state authorities design policies based on narratives derived from research at large scales.
Doing a context-specific analysis of conflict-forest loss dynamics would be critical to developing interventions that will enable Colombian authorities to both build and sustain peace and halt tropical deforestation in its territory.
Given the findings of our study, it makes sense to design interventions that bring together approaches aimed at both goals. These approaches include those promoting reducing emissions from deforestation and forest degradation (REDD+), and fostering conservation, sustainable management of forests and enhancement of forest carbon stocks, as well as those supporting the greening of agricultural supply chains.
What drives deforestation in Colombia during times of conflict and peace varies according to what you are looking at. Future work building on this study could examine how efforts to conserve forests can promote peace, and, conversely, how efforts to promote peace can facilitate forest conservation in Colombia.
Ganzenmüller, R. et al. (2022) What peace means for deforestation: An analysis of local deforestation dynamics in times of conflict and peace in Colombia, Frontiers in Environmental Science, doi: 10.3389/fenvs.2022.803368.
-
Guest post: In conflict and peace, what drives deforestation in Colombia?