Guest post: India’s emissions will double at most by 2030
Multiple Authors
08.22.18Multiple Authors
22.08.2018 | 12:16pmNavroz K Dubash is a professor and Ankit Bhardwaj is a senior research associate at the Centre for Policy Research (CPR)’s Initiative on Climate, Energy and Environment in New Delhi.
In a global climate regime built around national climate pledges – known as “nationally determined contributions” (NDCs) – it becomes essential to understand the likelihood of meeting these pledges.
However, understanding how national conditions will affect these pledges can be difficult, especially in rapidly changing developing countries, such as India.
India is undertaking multiple transitions driven by demography, urbanisation and energy access, amid rapidly changing policies and technologies. All these factors will shape its emissions future, which has considerable importance to the future of global emissions.
This means assessing how its emissions will be affected by national development goals, such as access to energy, becomes important for projecting future emissions.
Understanding India’s trajectory
Our paper, recently published in Environmental Research Letters, explores these challenges.
We interpret seven recent studies that project India’s emissions up to 2030 in the context of the country’s energy needs for development. (Therefore, the paper only explores CO2 emissions from energy – 68% of India’s total greenhouse gas emissions in 2012.)
An important motivation for the study is the wide range of existing projections of India’s emissions, which defy clear discussion or policy interpretation.
Our analysis begins by making explicit the implied policy assumptions underlying these scenarios. The figure below shows how studies with similar policy assumptions cluster together in terms of emissions and economic growth projections. This process illuminates the link between particular policy directions and their potential emissions impacts.
![Projected annual CO2 emissions in India from energy projections in several recent studies. The figure plots carbon dioxide emissions from energy in 2030 against average annual GDP growth rates used by each scenario, named after its respective study. The secondary y-axis on the right indicates percent change from the 2012 level. The red dotted lines represent the CO2 emissions from energy in 2030 at different average annual GDP growth rates from 2005, corresponding to India’s INDC target of a 33-35% reduction from the GHG intensity level in 2005. The proportion of CO2 emissions from energy in the total mix is assumed to remain the same in 2030 as in 2012. Scenario acronyms are clustered and coloured as per their policy assumptions. Scenarios are labelled as either reference [R] or aspiration policy scenarios [P]. When more than one scenario is included from the same study, the scenario acronym is annotated with a number, eg. [R-1],[R-2],[P-1],[P-2]. Source: Dubash et al. (2018)](https://www.carbonbrief.org/wp-content/uploads/2018/08/Projected-annual-CO2-emissions-in-India-from-energy-projections-in-several-recent-studies.jpg)
Projected annual CO2 emissions in India from energy projections in several recent studies. The figure plots carbon dioxide emissions from energy in 2030 against average annual GDP growth rates used by each scenario, named after its respective study. The secondary y-axis on the right indicates percent change from the 2012 level. The red dotted lines represent the CO2 emissions from energy in 2030 at different average annual GDP growth rates from 2005, corresponding to India’s INDC target of a 33-35% reduction from the GHG intensity level in 2005. The proportion of CO2 emissions from energy in the total mix is assumed to remain the same in 2030 as in 2012. Scenario acronyms are clustered and coloured as per their policy assumptions. Scenarios are labelled as either reference [R] or aspiration policy scenarios [P]. When more than one scenario is included from the same study, the scenario acronym is annotated with a number, eg. [R-1],[R-2],[P-1],[P-2]. Source: Dubash et al. (2018)
We draw a distinction between “reference” scenarios that project a future based on current policies and “policy” scenarios which model aspirational policies. We further break down reference scenarios according to their base year of current policies (“reference-pre-2015” and “reference-2015”), capturing the rapid changes in policy over the past few years.
Policy scenarios are broken down into those that are solely based on national development objectives, such as energy security (“policy-national”), and those that also include global climate objectives (“policy-hybrid”).
In a second step, we examine the results of the clustering with reference to recent policy statements and trends in India. In this way, we assess how studies interpret their results to represent future directional changes in India’s policies and, hence, likely emissions futures.
National energy models
As the chart above shows, India’s emissions, which start at a very low per capita base, will certainly grow. All studies project an increase up to 2030, though with a wide range of 12% to 169% above 2012 emissions. This large range of potential increase – which is higher than India’s current emissions and approximately equivalent to the European Union’s emissions – is primarily explained by the varying policy assumptions of the scenarios.
The most useful cluster of scenarios to use as a starting point are those that project out from recent policies (“reference-2015”). This subgroup of scenarios suggests India’s CO2 emissions from energy will grow to 3.8-3.9 gigatonnes (Gt), or 91-98%, above 2012 levels, by 2030. This increase is consistent with India’s climate target to reduce its emissions intensity by 33-35% of 2005 levels by 2030.
Based on current policy, we find that this projection, which corresponds to a doubling of emissions from a 2012 baseline, is a likely upper bound for India’s 2030 emissions.
There are two reasons for this. Firstly, the corresponding scenarios assume a higher-than-historical GDP growth rate until 2030. Second, the studies assume a partial implementation of policies and, hence, provide some leeway for political realism in implementation.
“Policy” scenarios, especially from the “hybrid” category that incorporates global mitigation imperatives, indicate the potential for further decarbonisation, even at the same economic growth rates.
To place these results in global context, a doubling of 2012 emissions, while certainly significant, will put India’s 2030 emissions at less than half of China’s emissions in 2015.
As the chart below shows, India’s CO2 emissions from energy are the fourth largest in the world and rising. However, they remain less than a quarter of China’s and half of the US’s. They are low in per capita terms, sitting at 1.7 tonnes per capita in 2014 compared to a global average of 4.9 tonnes per capita.
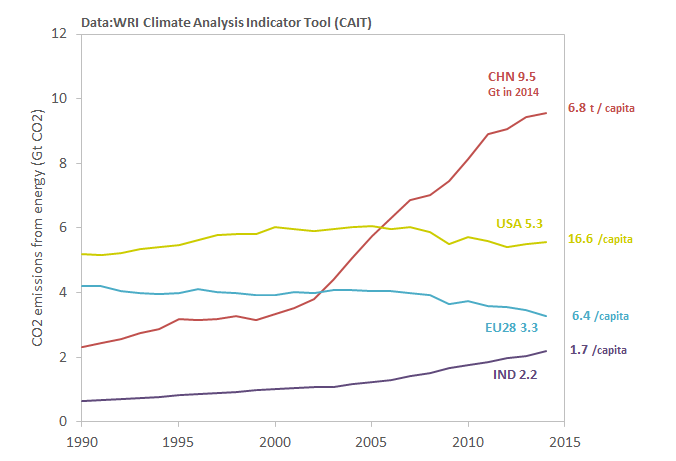
Energy-related CO2 emissions history of China (red), the US (yellow), the EU28 (blue) and India (purple). Per capita figures in 2014 are given to the right-hand side of the chart. Note that the data in this figure include negligible amounts of non-CO2 gases from other fuels and fugitive emissions which could not be segregated in the dataset. Source: WRI Climate Analysis Indicators Tool (CAIT)
Thus, while India’s emissions will be significant over the coming decade or so, they will not rise to the same scale and at the same pace as China’s in the previous decade.
Importantly, even at these levels, India’s per capita emissions in 2030 will be less than today’s global average.
Interpreting recent trends
Many of the studies of India’s future emissions are framed around meeting development goals, such as the provision of services to the poor, job creation, full energy access and energy security.
But translating these broad goals to energy trends can be opaque and inconsistently embedded in the underlying assumptions of the models. This can make gauging the policy relevance of model results difficult, especially as assumptions and narratives can be outdated in relation to more recent shifts.
Therefore, in our paper, we try to unpack the energy trends emerging from the seven studies we cover, such as energy demand, primary energy supply and sources for electricity generation.
We find broad agreement that energy demand will rise considerably. Coal will continue to be significant, much more so than other fossil fuels. And, while renewable electricity will rise rapidly, total electricity demand may well rise faster.
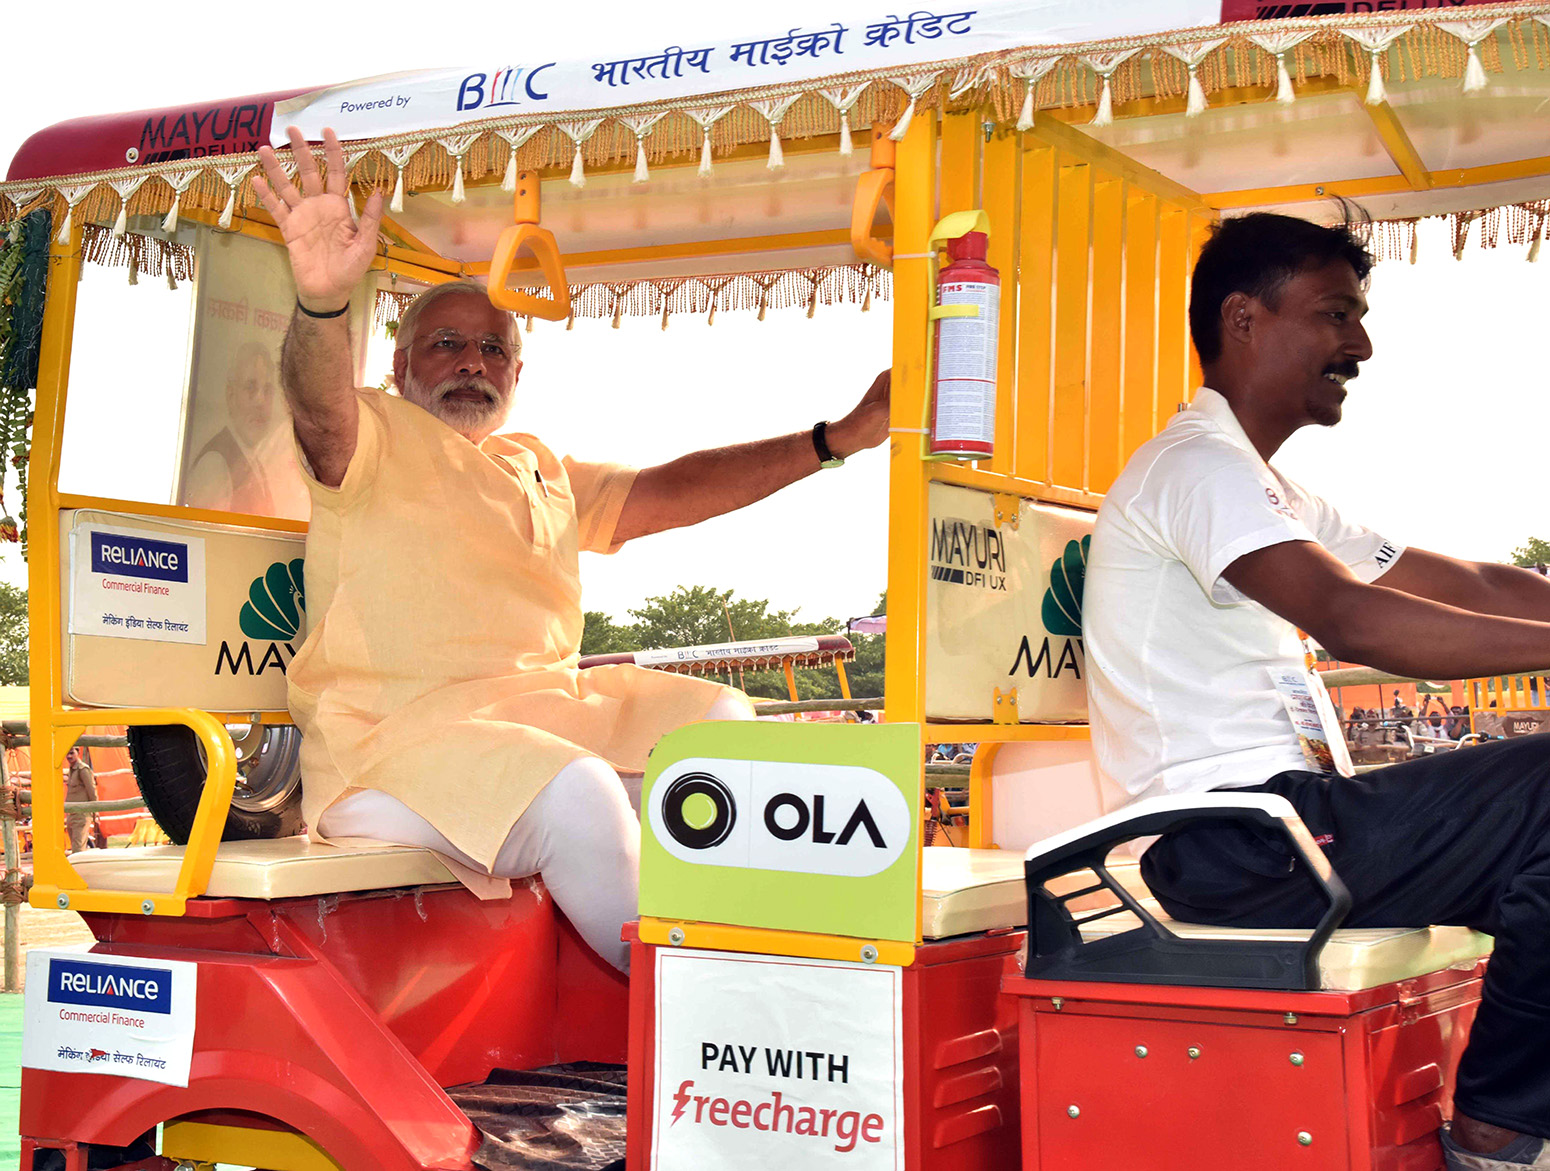
Indian Prime Minister Narendra Modi rides an all-electric motorised rickshaw after distributing 1000 of the vehicles to constituents. Varanasi, India, 1 May, 2016. Credit: PIB / Alamy Stock Photo.
However, we also examine these projections in light of the most recent policy trends. For example, changes in India’s dynamic electricity sector point towards lower-than-expected electricity demand and a faster-than-expected transition from coal to renewable electricity. Official electricity planning documents, such as those by India’s Central Electricity Authority, estimate lower-than-anticipated demand until 2027. This is based on assessments by utilities and on lower than previously estimated rates of generation.
India has also benefited from a global decline in renewable prices, leading to a faster uptake of renewables than previously expected.
So, falling demand and cheaper renewables have both contributed to the increasing unviability of coal-generated power, as evidence by growing investor caution. Taken together, these trends point to a lower carbon future of India than those anticipated even by current policies and internalized in the models. Therefore, the results from this step reinforce the idea that a doubling of emissions from 2012 levels is the likely upper bound for 2030 levels.
Moving forward, this study draws out a broader lesson for analysing global emission futures: in a post-Paris world, an understanding of global emissions trajectories will need to be built on a granular understanding of national energy and development debates. This is particularly true – and particularly hard – in rapidly changing emerging economies. National energy and emissions modelling, backed by interpretation as undertaken here, will become as necessary as global models are to addressing the climate problem.
Dubash N. K. et al (2018) India's energy and emissions future: an interpretive analysis of model scenarios, Environmental Research Letters, doi/10.1088/1748-9326/aacc74
-
Guest post: India's emissions will double at most by 2030
-
Guest post: Interpreting India’s emissions future