Guest post: Mapping the most influential Twitter accounts during COP26

Guest authors
11.01.22Guest authors
01.11.2022 | 3:12pmSocial media platforms increasingly shape the flow of information and influence around the world today.
In the rapidly evolving global media landscape, key networks of opinion are built on the interactions between users sharing content and powerful individuals and groups generating attention. The world of global climate politics will soon tune in to another COP summit – this time at COP27 in Egypt.
Through the mapping and analysis of Twitter activity during last year’s COP26 in Glasgow, our new study shows how a physical event in climate politics extends to the virtual world of the web.
We highlight how dominant Twitter accounts – from the US president Joe Biden through to campaigner Greta Thunberg – produce power and influence in climate change communication.
Our analysis (pdf) reveals how clusters form around these accounts, functioning as a kind of “mass media” that spreads their voice to a wide audience.
We also reveal how similar clusters form around climate sceptics, but on the margins of the debate and with links to extremist content and conspiratorial messaging.
The event, real and virtual
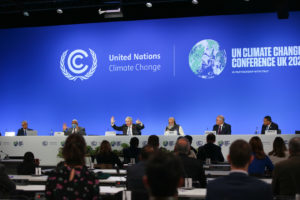
In late 2021, almost 40,000 participants representing 194 countries gathered in Glasgow, Scotland, for the 26th annual United Nations Framework Convention on Climate Change (UNFCCC) Conference of the Parties (COP26). This was the largest climate summit of its kind in more than 25 years of annual conferences.
Outside the summit’s political core, protestors flooded the streets of Glasgow. They called out world leaders for failing to act rapidly enough to respond to climate change, and voiced loud demands for climate justice for vulnerable groups and nations.
Conflicting visions of the future on display inside and outside COP26 captured the attention of global journalists, shaping the headlines and news stories emerging from the summit.
Mainstream news narratives about COP26 reproduced a script familiar from our past media research on summit journalism.
This storyline underscored the friction between nation states, political and corporate elites, and diverse civil society groups. It focused on world leaders and famous names on the scene, covered the massive demonstrations, highlighted hopes and tensions surrounding the final document, and – as with so many times before – waited as negotiations moved into “overtime”. Finally, the news script shifted to public assessments of key outcomes from the summit and critical analysis of which elements of the final agreement represented firm commitments and which were watered down.
While tens of thousands of people gathered inside and outside the summit venue in Glasgow, the event simultaneously occurred online, not least on social media. On these platforms, a mix of groups – from inside and outside the traditional global media sphere – interacted, weaving together virtual networks, clusters and communities.
Such network structures serve as key pipelines for flows of information, opinion and influence. They shape the virtual environments where political power is yielded and created.
While applications and platforms evolve rapidly, in the west, at least, political elites, scientists, climate activists and sceptics invest considerable energy trying to exert influence on Twitter.
Structure of COP26 Twitter sphere
By clicking the “retweet” button, Twitter users harness a small, but accumulating power resource: the selective rewarding of tweets that they deem worthy of attention.
Digital mapping and analysis of the retweeting activity of millions of users during COP26 enables us to describe the overall social network structure of climate change communication on Twitter.
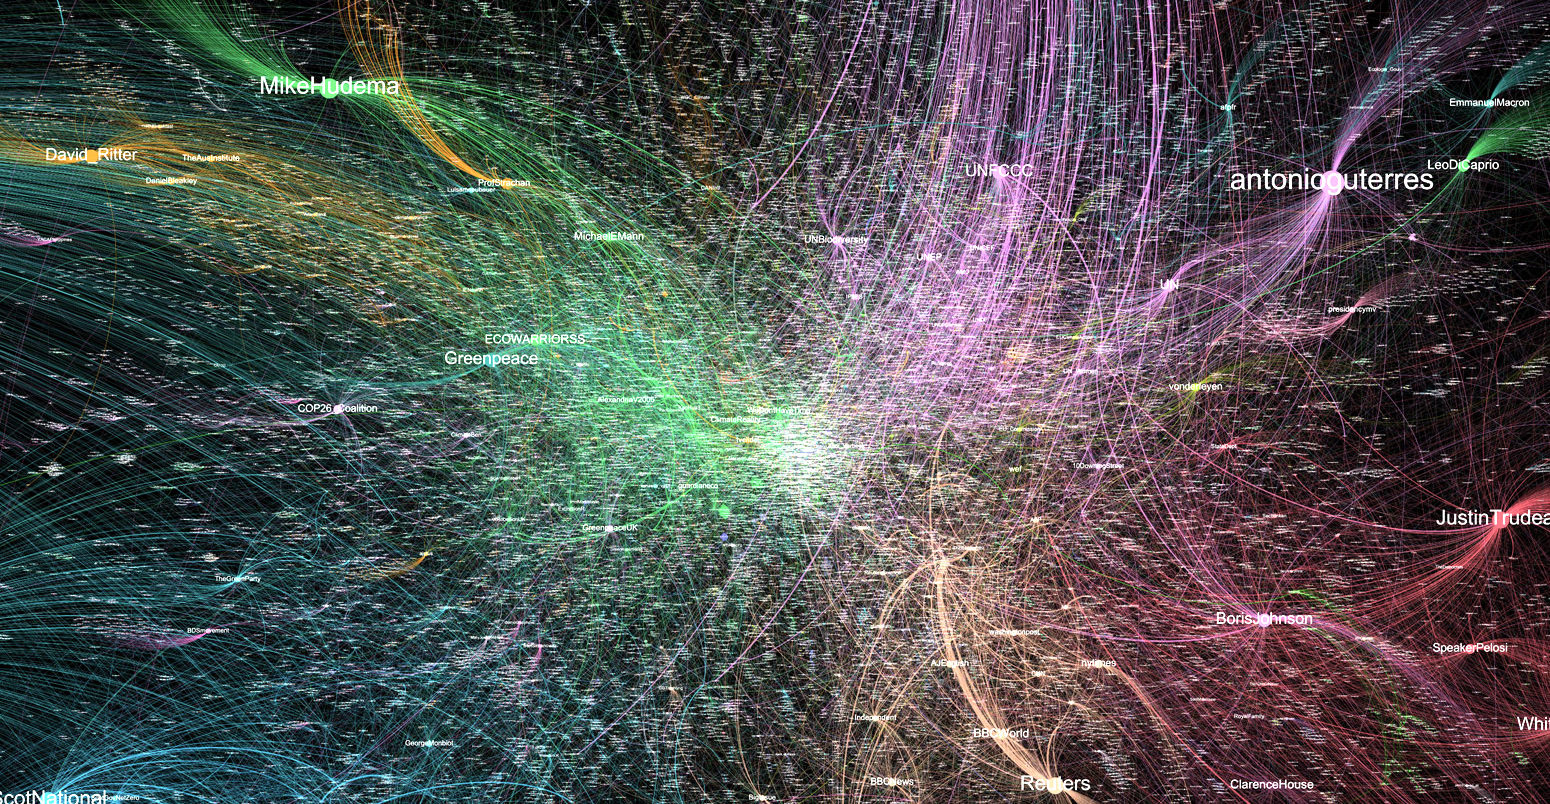
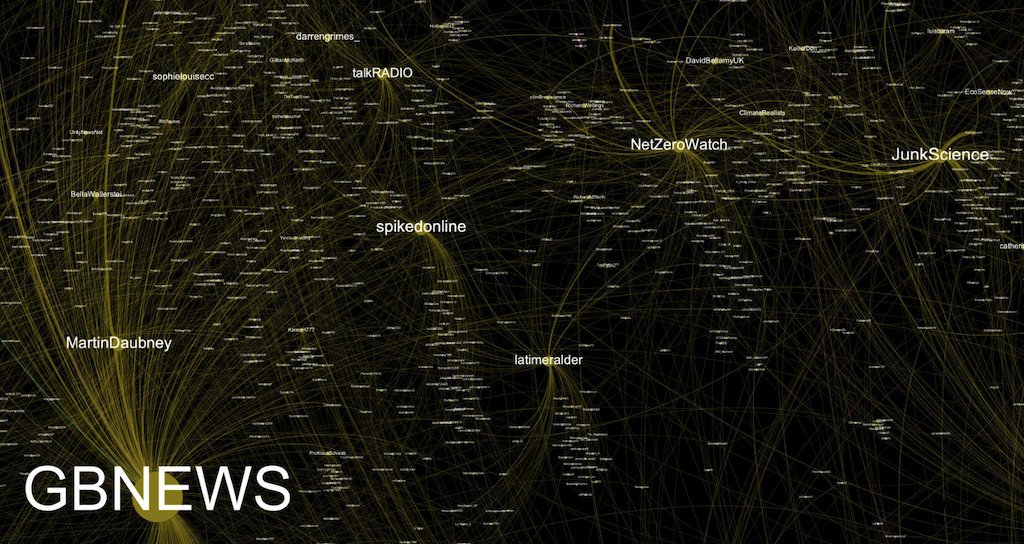
This is visualised in the network map below, where different clusters of Twitter-accounts (“nodes”) represent the patterns of retweeting activity that surrounded influential user accounts during the Glasgow climate talks.
On the map, node sizes are determined by how frequently a user gets retweeted by other users in the same cluster. Simply put, the larger the node, the more influential that user is within a given cluster. Edge lines on the map show connections between nodes within a cluster. The different colours are used to differentiate between clusters where user accounts are engaged in similar kinds of activity, and thereby grouped into distinct “communities”. The rough locations of these communities on the network map reflects their proximity and represents connections between the clusters.
For the sake of readability, we have pulled some of the dominant single nodes further apart. Clicking on the image below will open a larger, interactive version of the map.
COP26 retweet network map (click on the image for a larger, interactive version of this map). Daily Twitter API requests made between 28 October and 12 December were used to gather 11,667,143 tweets, of which 8,921,103 were retweets. To facilitate analysis, the sample was filtered by removing all user accounts with a small number of daily retweets on average around four daily retweets. This produced a final retweet network with 48,470 nodes and 77,824 edges. All nodes and edges were then spatially positioned and colourised, using community detection and layout algorithms. Kunelius et al. (2022)
The mapping of the COP26 Twitter data illustrates eight large clusters of influential retweeting with distinct colours, which are summarised in the table below. Closer analysis of this social sphere of climate points to some key findings and conclusions.
| Name | Structure | Colour | Total retweets |
|---|---|---|---|
| Greta Thunberg | Centralised | Turquoise | 588,608 |
| NGO-science | Diffuse | Green | 586,197 |
| Sceptic | Diffuse | Yellow | 526,863 |
| COP26 | Centralised | Neon pink | 436,189 |
| Mainstream media | Diffuse | Tan | 310,261 |
| UK/Scotland event | Diffuse | Neon blue | 229,884 |
| POTUS | Centralised | Orange | 206,535 |
| Narendra Modi | Centralised | Navy blue | 109,427 |
Eight largest COP26 retweet communities
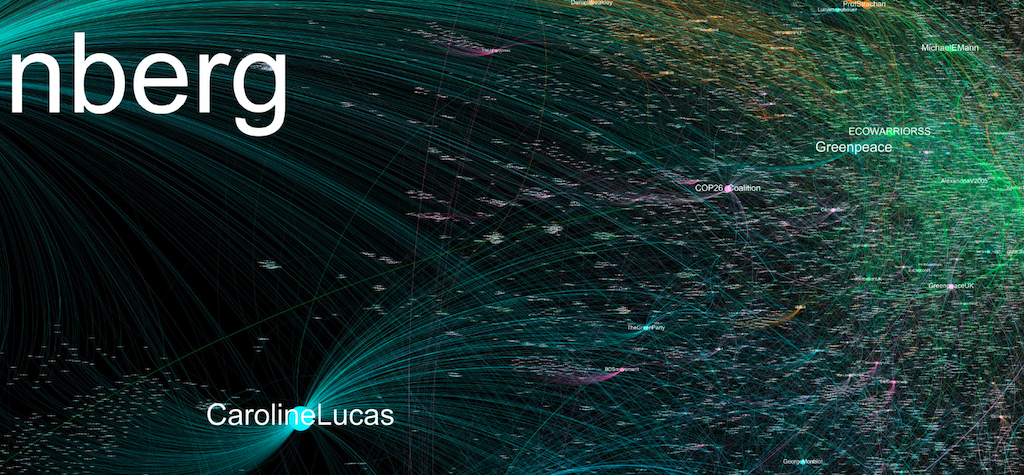
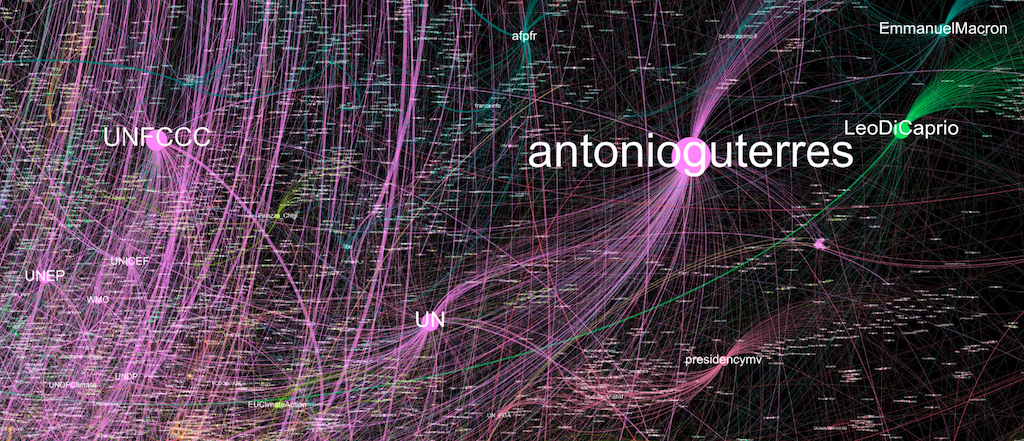
The map shows two unique clusters of individuals or accounts. First, highly centralised clusters form around Swedish activist Greta Thunberg, the official COP26 account, US president Joe Biden (POTUS) and Indian prime minister Narendra Modi.
These clusters are structured by a constant, high-volume flow of retweeting around these accounts. In fact, these accounts function as a kind of “mass media” within the socially mediated environment, spreading the central user’s voice to a wide audience with high effectiveness.

The map also reveals considerable retweeting between the three largest clusters (Greta, COP26 and POTUS) and other, smaller clusters. By contrast, the cluster around Narendra Modi is largely detached from this western trio. There are only weak links between it and the rest of the map. The cluster also has a more hierarchical shape, suggesting the spread of tweets from a central node (Modi) to a periphery of user accounts that otherwise remain isolated and disconnected from the rest of the COP26 retweet network.
Second, we observe four less-centralised clusters held together by multiple relatively large nodes. We name these four clusters thematically to reflect the types of users who are actively retweeted in each one: NGO-science, mainstream media, Scotland event and climate sceptics.
Interestingly, closer analysis of these clusters reveals close affinity between key scientific individuals and the accounts of major environmental NGOs. Strong retweeting alliances between these accounts possibly reflects an “advocacy” community that shares scientific knowledge and makes urgent calls for climate action.
Mainstream media outlets appear clustered together. Predictably, they are situated between the COP26 cluster, NGO-science, and a territory dominated by national political actors, including POTUS, Modi and several other recognisable heads of state (see right-hand side of the figure above).
Another diffuse cluster of UK-based political accounts is located closer to Greta Thunberg and the NGO-science clusters (left-hand side of figure). This may reflect the proximity of these groups to the physical event. For instance, climate demonstrations in Glasgow often engaged with local Scottish politics. It is certainly an effect of the strong Twitter presence of Caroline Lucas MP, former leader of UK Green party.
At the bottom of the map, our analysis reveals another cluster made up of climate sceptics. With no obvious singular leader, several strong accounts hold this cluster together.
As with the Modi-cluster, the sceptics appear on the fringe of the map separate from other clusters. This is indicative of the weak ties between climate sceptics and user accounts in other clusters. The sceptics are not actively engaged in the arguments and debates about policy choices during the summit. The isolation of this cluster is partially due to the blunt disavowal and mockery expressed by these users of the entire UNFCCC process.
Modes of power
Our analysis reveals different modes of political power that shaped COP26 as an event on Twitter.
The dominant position of individuals such as POTUS and Modi is easily understood. The attention they receive speaks of how politicians, controlling the decisions and resources of nation-states, can translate their political power into attention in the social media sphere.
The power of COP26 and UK-Scotland event clusters is more closely related to their geographic centrality at the COP gathering. These groups – particularly COP26 – are tightly linked to the actual unfolding of this event, shaping its daily themes, sessions and spotlights. In this sense, they carry natural event power.
For the UNFCCC, attracting this attention is strategically essential. As the UN body governing the COP process, its influence has been largely based on gathering decision-makers under the lens of global attention – and hoping to create public pressure for climate action. It seems, as far as attention goes, this influence pays off on Twitter.
Communicative power of youth
Other clusters suggest a different logic. Both Greta Thunberg and the much weaker sceptic cluster raise questions about how presence and success inside social media networks themselves create attention power.
This is obvious – and quite remarkable – in the case of Thunberg. Only joining Twitter in June 2018, in less than five years she has come to yield more influence in our social media event network than the US president. This power arises from both the retweeting volume of grassroots followers and the sharing activity of influential users.
Through Thunberg’s public personality, the youth climate movement has achieved considerable communicative power. In social media, she speaks with a collective voice that other individuals and groups in climate communication must recognise and take into consideration.
Her account draws attention and shares from politicians, influential journalists and celebrities. For example, the most widely shared tweet by Reuters during COP26 links to a story about Thunberg’s speech at a Glasgow demonstration. This testifies to her ability to build and support strategic alliances between clusters in the COP26 network.
Sceptic identity networks
Despite a marginal location on the map, the sceptic cluster is recognisable for its independence from established power holders, accounting for 6% of total retweets (526,863) in our sample.
Nonetheless, recent analysis of climate disinformation online suggests the influence of small networks of climate disinformation superspreaders can be far-reaching.
In addition to its isolation, it is noteworthy that accounts in this cluster are not strictly focused on climate. The most viral retweets among sceptics often spread attempted irony, sarcasm and ridicule of political elites – a stylistic feature visible in some of Thunberg’s most popular tweets. Yet, drilling deeper into this network quickly exposes links to individuals, websites and platforms that traffic in extremist content.
We discovered a broad suite of such extremist and conspiratorial messaging, linking critiques of urgent climate action to prevalent social, cultural and political issues – including anti-vaccination and opposition to Covid-19 public health measures, condemnation of the so-called tyranny of “global elites”, and anti-immigration rhetoric.
This demonstrates how communication on social networks can effectively weld together different issue networks and enhance emergence of self-enforcing ecosystems of information, opinions and influence.
The Greta Thunberg and sceptic clusters showcase the potential for the broad social media sphere to act as a source of social and political power. In this article, we lack space to elaborate on the content or argumentation in the most viral tweets in each cluster.
Yet, even our broad mapping of these network structures leads us to conclude that their communicative powers are each of a different kind: one engages with other communities and individuals in climate politics, the other draws its energy from exclusion.


Kunelius, R. et al. (2022) Analysing the 2021 Glasgow climate summit (COP26) on Twitter: A work-in-progress report, Helsinki Institute for Social Sciences and Humanities (HSSH), University of Helsinki.