Guest post: What ‘credible’ climate pledges mean for future global warming

Prof Joeri Rogelj
06.08.23Prof Joeri Rogelj
08.06.2023 | 7:00pmAlmost every country in the world has signed up to the Paris Agreement’s goal of keeping warming well-below 2C and pursuing efforts to limit it to 1.5C.
As countries gear up to conclude the first “global stocktake” of progress under the Paris Agreement, you might be wondering how things look for the long-term temperature target.
This seems a simple question, but when looking around for answers one cannot help but come back either disappointed or confused.
On the one hand, some studies, policy trackers and UN reports (including by the IPCC or the UN climate convention’s secretariat) suggest that current policies lead the world well past the 2C mark. Estimates range anywhere in the general 2.5C to 3C range, but with a common thread: they all clearly fail to meet the Paris Agreement.
On the other hand, the UN environment programme, plus other studies and reports, suggest that achievement of the Paris Agreement is right there in front of us, within reach if not for a slight additional push. These estimates project warming already below 2C and moving towards the 1.5C limit.
These two answers span an unhelpfully broad range from “disaster avoided” to “disaster confirmed”.
In our latest study, published today in Science, we try to provide greater clarity in this regard.
We find a clear answer to the difference between the two extreme outcomes.
The latter set of estimates takes all pledges at face value, both near-term pledges until 2030 – which are called nationally determined contributions (NDCs) – and longer-term pledges until mid-century and beyond.
The former set of estimates only considers policies that are on the books and being implemented.
Taking into account only the most credible climate pledges, we find that warming would reach 2.6C by the end of the century. However, extending this to include all climate pledges brings it down to 1.7C.
Building a clearer picture
In our new study, we try to peel back some of the layers that cover typical assessments of emissions and global temperatures in the context of the Paris Agreement.
In short, we run through a set of steps to translate country pledges and policies into global emission and temperature projections, and systematically show how reasonable choices by analysts can affect the outcome.
Let’s have a look at each of these steps.
First, it is tricky to know exactly what current policies or current NDCs add up to by 2030, as there are several aspects that NDCs are not explicit about and which need to be interpreted by analysts.
This does not change the big picture, but it does mean that estimates of 2030 greenhouse emissions under current policies or NDCs, at best, end up with a range. Any study that reports a single number or very narrow range is most likely overconfident.
The emission implications of these near-term pledges or policies can subsequently be projected forward. The scientific literature uses a variety of measures as a proxy for the continuation of action post-2030.
In our study, we use greenhouse gas pricing as a proxy for the strength of wider climate policy. We assume the prices implied by the policies or pledges for 2030 will continue throughout the century – either at a constant level or gradually increasing. As a default best estimate, we pick a value close to the projected global GDP growth rate, but there is no reason why it could not be higher or lower.
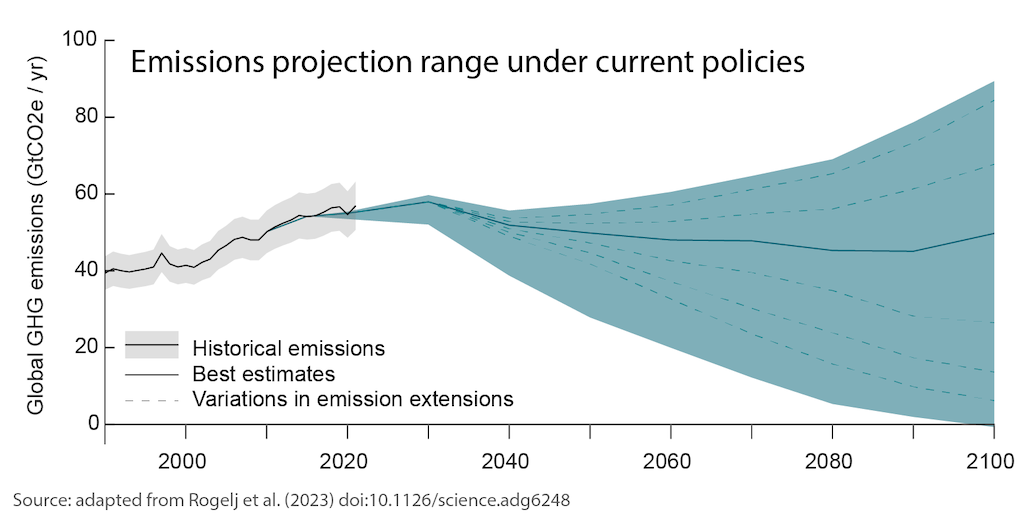
The resulting range of emissions outcomes for current policies out to 2030, followed by constant or increasing policy stringency over the rest of the century, is shown in the figure below.
We test a wider range of assumptions in the paper. While they change the shape of projected emissions, they don’t change the fundamentals: current policies provide a very weak constraint on where emissions end up over the 21st century. (Having said that, current policies do seem to rule out emissions at the top end of the range.)
The next step is to consider longer-term pledges, which, in many cases, take the shape of net-zero targets. In the figure below, we considered the full achievement of near-term NDCs and long-term net-zero targets. Our study does not consider every single net-zero target, but covers each country that is responsible for at least 0.1% of current global emissions. When we take pledges at face value, emission projections decline sharply and also the range is narrowed markedly, shaded green below.
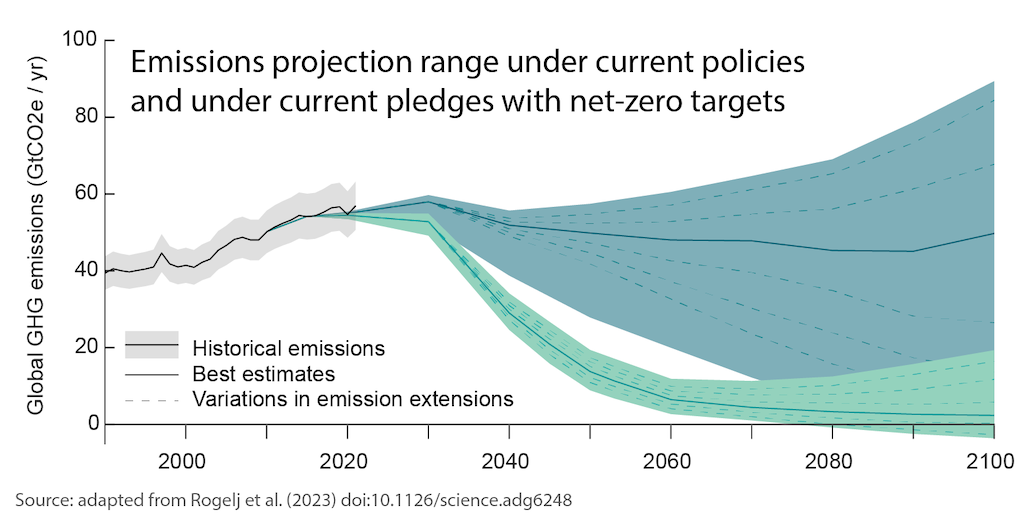
This much narrower range does not imply that the outcome is more likely, it merely means that fewer assumptions are left open to analysts when creating the projection. Indeed, a net-zero target set for a given year allows for only very limited room for additional interpretation.
Credible steps
Recreating two cases that the literature already covers, however, is clearly insufficient to provide the clarification we seek: in a world that leaves open these two opposing futures, to which are we heading?
To answer this question, we came up with a way to assess the quality and credibility of current net-zero targets. We used this assessment to derive three additional scenarios in which net-zero targets were in – or excluded – depending on how well they scored.
The three measures against which we assessed a net-zero target’s current credibility were: whether it is legally binding; whether it is accompanied by a clear implementation plan; and whether a country’s current policies are already putting its emissions on a downward path.
More or better criteria could be devised, but these provided us with a workable set informing aspects of the target’s foundation, intent and delivery. Ultimately, targets were given a higher, lower or much lower current credibility rating depending on how they scored on the three measures combined. (For more details, see the paper.)
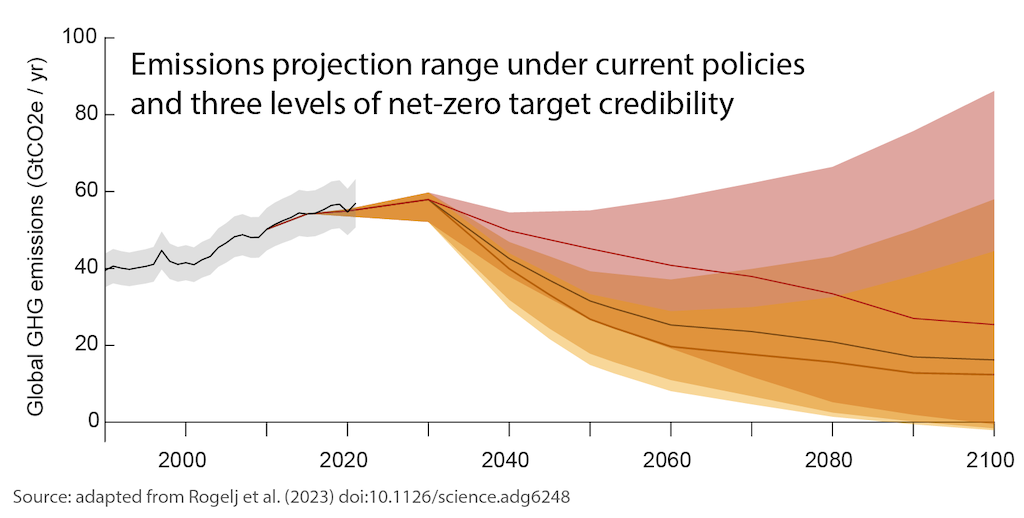
The figure below shows how global emissions would change over the rest of the century, depending on which net-zero targets are met. The red shading shows emissions if only the most credible net-zero targets are assumed to be met. The dark orange includes high- and low-credibility targets, while the light orange range includes all net-zero targets.
What’s the temperature?
With five cases differentiated by the credibility of targets included in them, we can now have a look at what this means for global warming (see figure below).
We use a simple climate model that was calibrated to the latest climate assessment of the IPCC to capture uncertainties in the best possible way.
In the most conservative case – Case A – where we only account for current climate policies, we find that global warming can still rise to 2.6C by the end of the century, continuing thereafter.
This central estimate is shown by the horizontal grey line to the left of Case A. However, this is only the central estimate and a range of uncertainties mean actual warming could be much higher – or much lower.
First, variations in emissions projections that we looked at above can move this central estimate up to 3C or down to 1.7C, depending on how one assumes policies are continued after 2030. These uncertainties are illustrated by the blue outlines to the right of Case A and the coloured horizontal lines to the right.
Second, even for the best-estimate emissions path, uncertainties in the climate system mean that there is still a 10% chance that warming ends up at 3.3C instead of the 2.6C median. These climate system uncertainties are shown by the shaded blue columns.
At the other end of the spectrum in Case E, where we assume all pledges are duly implemented, we find a 1.7C central value for our best estimate emissions, but with still about 20% likelihood that 2C is exceeded. Finally, Case B, where only higher credibility net-zero targets are included, shows where current evidence most likely puts our global warming outlook for this century: a median 2.4C with a 10% likelihood of exceeding 3C – and that is if we believe our central best-estimate for emissions.
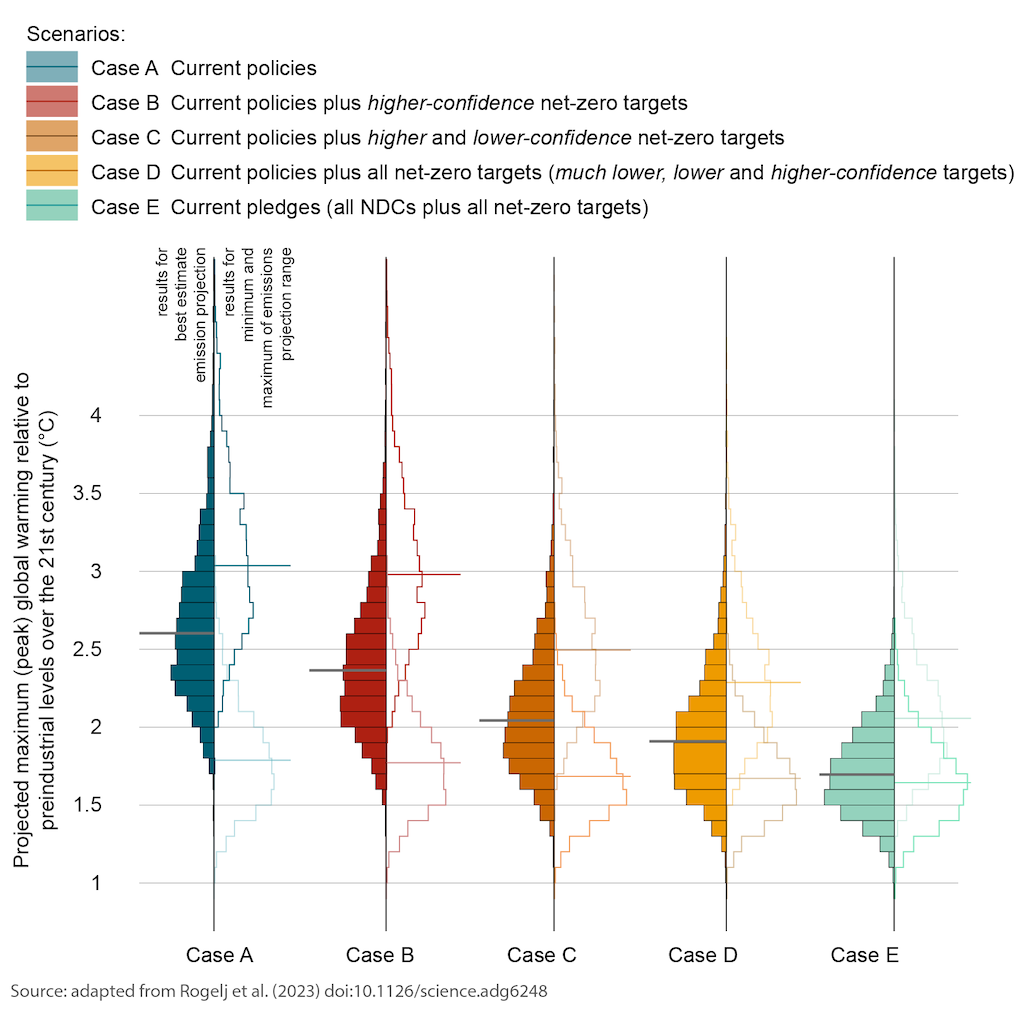
Case C and Case D (orange and yellow in the chart above), where less credible net-zero pledges are also fully implemented, would result in a central warming estimate of 2.0C and 1.9C over the course of the century, respectively.
Expect to improve
Coming back to the opening question, how are we doing in achieving that Paris Agreement long-term temperature goal? Our findings show there is still a lot of work ahead, if warming limits are to be avoided. However, this is not unexpected.
In order to move closer to the Paris goal, countries will need ambitious targets and pledges aiming for emissions reductions well beyond what current policies would achieve.
These pledges would have to be further strengthened and followed with policies, implementation and – crucially – delivery of the emissions reductions needed to avert dangerous warming.
Without these steps, our study shows that disastrous levels of warming cannot yet be ruled out.


Rogelj, J. et al. (2023) Credibility gap in net-zero climate targets leaves world at high risk, Science, DOI: 10.1126/science.adg6248.
-
Guest post: What ‘credible’ climate pledges mean for future global warming