
Guest post: What seasonal forecasts can tell us about extreme heat this summer

Chloe Brimicombe
04.04.22Chloe Brimicombe
04.04.2022 | 12:22pmAs daily temperatures start to climb through the northern-hemisphere spring, attention starts to turn to the summer months and the chances of seeing periods of extreme heat.
Even ahead of the summer season there have been media reports of a potential “hottest-on-record” Easter weekend for the UK.
While weather forecasts typically focus on the days or week ahead, seasonal forecasts can give us an insight into whether a coming month or season is more or less likely to bring extreme conditions, such as a heatwave.
These warnings can be crucial. Heatwaves can cause a spike in hospital admissions as people struggle with heat stress – the build-up of body heat as a result of physical exertion and/or the surrounding conditions. Having sufficient warning would allow people – and healthcare services – to prepare.
Our seasonal forecasts for this summer suggest that the UK is unlikely to see extreme heat, but parts of north Africa could see periods of dangerous heat stress.
Seasonal forecasting
Unfortunately, seasonal forecasting is not as simple as pinpointing a heatwave – a period of above average temperatures for three or more days in a warm season – at a certain time in the months ahead.
Because of the chaotic nature of the world’s weather, a forecast several months in advance can only provide an indication of the likely weather conditions. So, for seasonal timescales, we use probabilistic forecasting.
A simple way to explain probabilistic forecasting is to think about trying to predict how quickly a particular runner will complete the marathon at the next Olympic Games.
Say you had some background information on the runner – their age, injury record and past performances, for example – but you were only allowed one guess of their time. You would be quite hard-pressed to get it close so far from the event.
Now imagine you are allowed 50 predictions. The majority of these predictions will likely cluster around the runner’s recent times, but you would have some that were slower and faster to give a spread of possibilities. While it would still be very difficult to predict the exact time, how those predictions are grouped would give an indication of how confident you were about the runner’s likely time.
When we run a probabilistic forecast from the European Centre for Medium Range Forecasts (ECMWF) seasonal forecasting system SEAS5, we have a collection – or “ensemble” – of 50 simulations, each running a slightly different variation of our weather and climate. As with the marathon times predictions, each simulation will come up with a different forecast of the weather, but some will be quite similar.
For example, some of the simulations might suggest that the second half of August will be very hot in southern Europe – and then a subset of these might indicate the extreme heat is most likely to be in the last week of August and in a particular group of countries. We use these similarities to quantify the likelihood of a particular forecast.
The maps below show our seasonal forecasts for Europe in April, which we made in March (top) and December last year (bottom). The colour of the shading indicates the likelihood of temperatures being in the highest 20% of the baseline climate (1993-2016) – from dark red (70-100% likelihood) down to blue (0-10%).
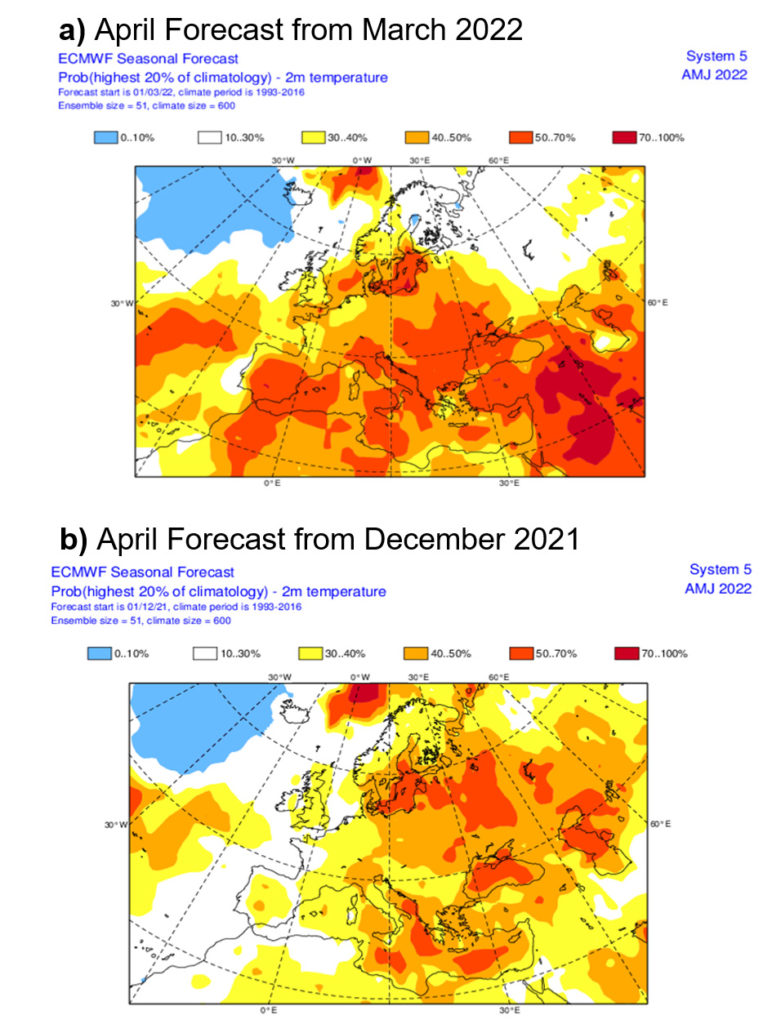
Both forecasts suggest a 30-40% likelihood of hot conditions in the UK during April. However, the Mediterranean and North African region show more “agreement” in the March forecast – 50-70% for large areas of Spain, Italy, Serbia and Romania, and 70-100% for parts of the Middle East. This level of agreement is suggestive of extreme heat levels.
We often see greater agreement within simulations of a forecast at a shorter lead time. And while we can use seasonal forecasting to suggest a signal of extreme heat, we can only currently forecast a heatwave accurately up to 10 days ahead of time. This depends on the region and what is going on in the world of weather.
Global forecasts for the summer
We can look even further ahead to see if there is any signal for heat for the northern hemisphere summer season of June, July and August. However, we should be careful to not make big claims – the further ahead we look the more uncertain we become.
We create seasonal forecasts for heat stress as indicated by the “humidex” – a heat index developed by Canadian scientists that combines temperature with humidity. The latter is a key factor in heat stress as moist air suppresses the human body’s ability to cool down through sweating. Forecasting humidex and other heat indices has the potential to help prevent deaths during a heatwave as a type of early warning system.
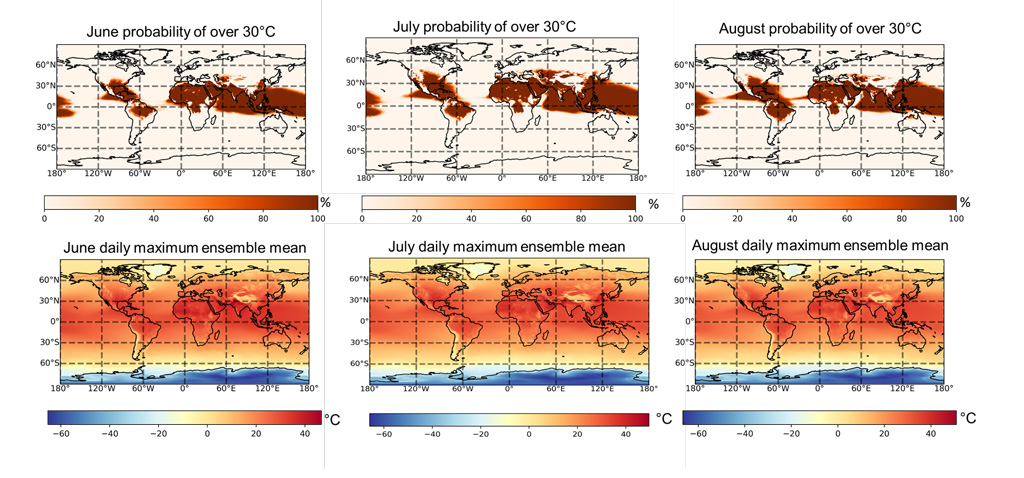
We use the humidex category for an index of greater than 30C – referred to as “some discomfort” – and focus on the monthly average of the daily maximum index. The maps below show that heat stress is very likely in parts of Asia, north Africa and South America this summer – with up to 100% of ensemble simulations having values over 30C (dark red shading in the maps in the upper row). There is also a signal for heat stress in parts of the Mediterranean over July and August (between 60 and 100%).
The average index for the summer across all the simulations – shown in the maps in the lower row – provides an indication of what sort of heat stress values we could see during each month. We can see from the red shading that the heat stress value is forecasted to exceed 45C – a dangerous heat stress category for humidex – for parts of North Africa. However, most regions are forecasted to stay below a heat stress index of 30C in the ensemble average.
In the UK, for example, humidex values are forecast to between 20C and 30C for heat stress in all summer months. This is not suggesting extreme heat, but could instead indicate pleasant conditions.
Past heatwaves
While we do not yet know how accurate our forecast for this summer will be, we can look back at how well previous forecasts have performed.
In early August of 2021, a heatwave hit much of the Mediterranean, breaking records, contributing to wildfires and causing the deaths of thousands of people.
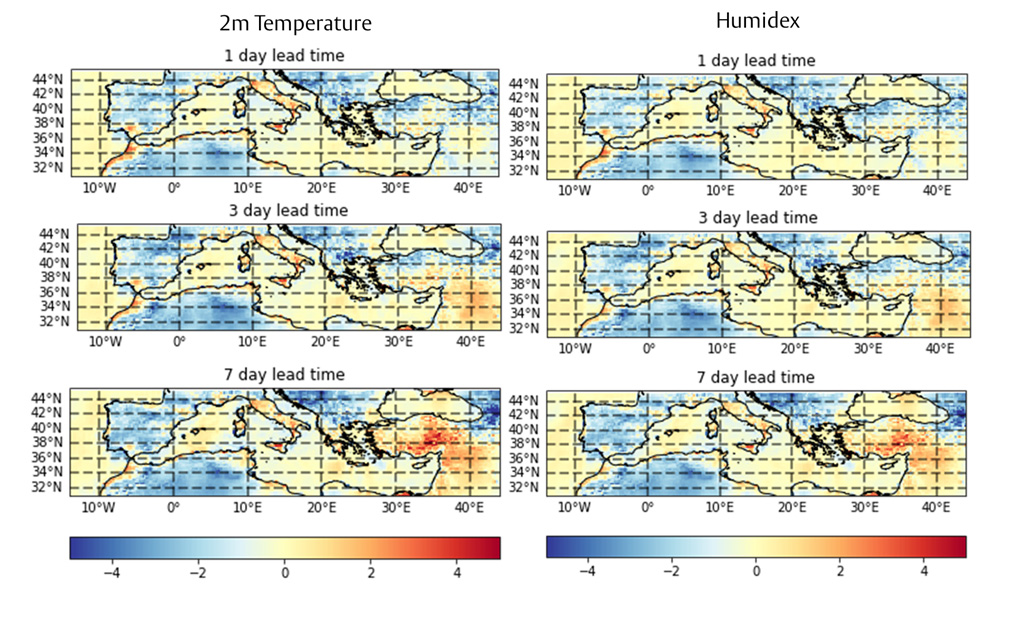
The maps below compare our seasonal forecasts for air temperature (left) and humidex (right) with the actual events using “reanalysis” data that combines observations and model simulations. The shading indicates a close match (yellow) or a forecast that was too hot (red) or too cold (blue).
At a lead time of seven days, our forecasts were generally within 2C of what the actual temperature or heat stress values turned out to be. This was despite this heatwave causing record-breaking values that our model of the weather had not experienced before. We see greater positive errors (red and yellow values) for Italy and the Arabian Peninsula at a seven day-lead time than for other areas. These reduce for the one day-lead time, but are still larger positive errors than for other regions.
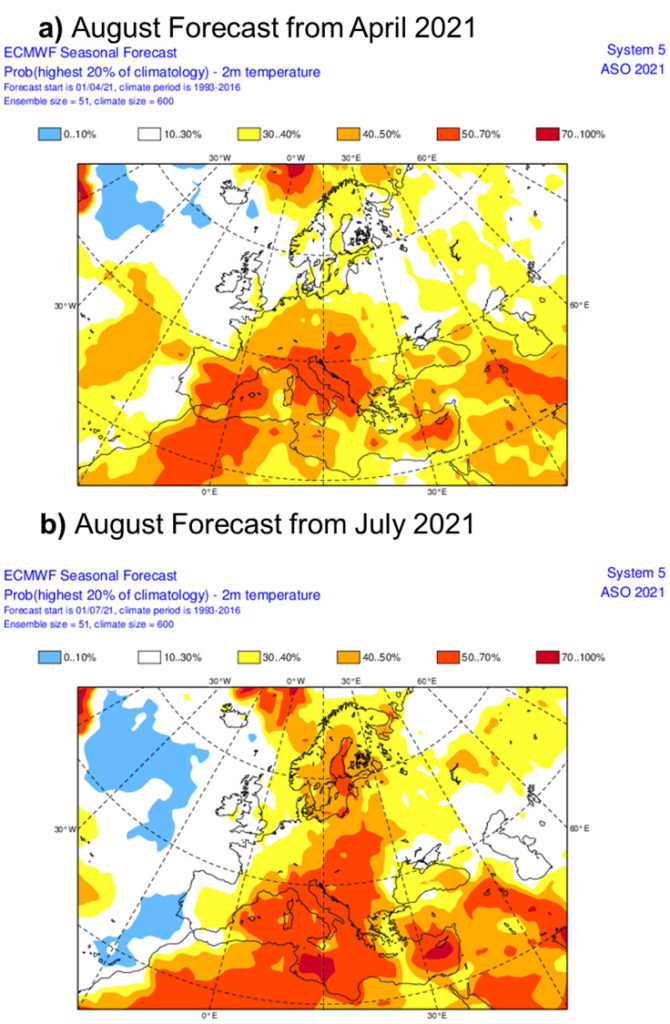
The maps below show the seasonal forecasts for the heatwave that were made in the preceding April (top) and July (bottom). The red shading shows that both suggest a 50-70% likelihood of hot conditions for large areas of the Mediterranean region.
This information could have been used to start earlier messaging about cooling strategies – such as having cold baths – and organising cooling centres and providing more support to healthcare facilities.
Seasonal forecasting is just one timescale of forecasting, with sub-seasonal to seasonal (weeks to one month) and medium-range forecasting (up to 10 days) also being potential options for extreme heat early warning systems.
However, the way information is communicated and having the right infrastructure is of equal importance to actually reducing heat impacts. Taken together, these tools could be used to build a global heat hazard awareness system and help tackle extreme heat using a range of forecasting timescales.
-
Guest post: What seasonal forecasts can tell us about extreme heat this summer