Guest post: Why India’s CO2 emissions grew strongly in 2017

Robbie Andrew
03.28.18Robbie Andrew
28.03.2018 | 11:59amRobbie Andrew is a senior researcher at the CICERO Center for International Climate Research in Norway.
India’s CO2 emissions grew by an estimated 4.6% in 2017, despite a turbulent year for its economy.
Measured per person, India’s emissions are still very low – at only 1.8 tonnes of CO2 per capita – which is much lower than the world average of 4.2 tonnes. But those emissions have been growing steadily, with an average growth rate over the past decade of 6%.
With India being the world’s fourth largest emitter of CO2, it is important to understand what the country’s emissions are currently and where they might be headed. Given India’s early stage of economic development, low per-capita emissions and its large population, there is significant scope for its emissions to increase.
India’s pledge under the Paris Agreement is to reduce the carbon intensity (see below) of its economy by 33-35% by 2030, compared to 2005 levels. Given projections of very strong economic growth over this period, emissions are expected to grow significantly.
Every year, the Global Carbon Project, of which CICERO is a key contributor, prepares a budget of sources and sinks of CO2 emissions. Alongside this budget is a projection of the current year’s global emissions, before the full year’s data is available. To build up this projection, we combine projections for several world regions. This year, India was added into the mix. The figure below shows the world’s top-four emitters, clearly showing the growing importance of India.
In a recent guest post for Carbon Brief, my colleagues and I discussed how and why our projected growth rate for China, made in Autumn 2017, was higher than the first official estimates released in February 2018. In this article, the focus turns to India.
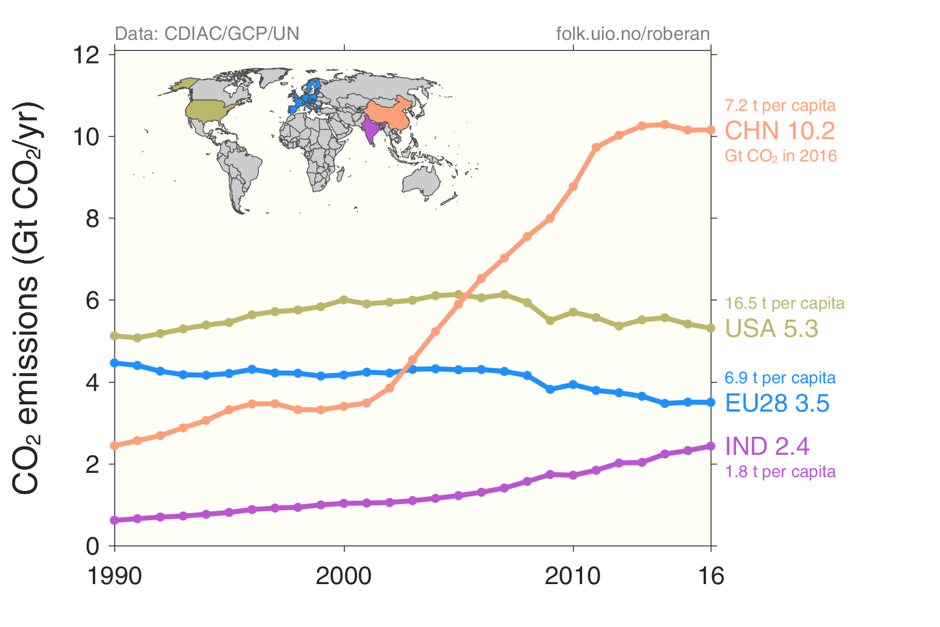
India has the world’s fourth highest CO2 emissions, but its emissions per person are very low. World-average per capita emissions were 4.2 tonnes in 2016. Source: CDIAC, Global Carbon Project, and UN.
Economics shocks
No year is the same in an enormous country with rapid economic development. But 2017 seemed particularly unusual in India because of two huge government interventions. The first, the “demonetisation” event, took place in November 2016, but its effects were felt for months afterwards. The second was the introduction of a new goods and services tax (GST, a kind of sales tax), on 1 July 2017.
On 8 November 2016, India’s prime minister Narendra Modi announced that all 500- and 1000-rupee banknotes, representing about 86% of cash in circulation, would become invalid at midnight and would thereafter have to be exchanged at banks. The purpose was to flush out corruption in the informal (untaxed) economy, which is almost entirely conducted in cash. With up to 50% of the economy and more than 80% of employment operating outside of government financial regulations, the consequence was chaos. As many as 1.5m jobs were lost, with virtually no long-term effect on the black market.
Similarly, the introduction of GST in July led to reduced economic output in June as retailers rushed to sell existing stock before the changes, based on a fear that stock held on 1 July would face higher taxes. While this had significant short-term effects on manufacturing, the impact did not end there, with the new tax system’s complexity confusing small business operators.
These two events had noticeable effects on the economy and, therefore, on emissions in the first eight months of 2017. Consumption of petroleum products in January, February and August were all lower than in the same months of 2016, with growth in the other months much lower than it had been the year before. Cement production – a strong indicator of economic activity, but also an emitting activity – was much lower than the previous year, more than 5% down in each of the first four months of 2017. And while coal consumption grew in most of these months, rates were lower than the year before.
Having reached 9.3% in Q1 (January to March) 2016, India’s official quarterly GDP growth rate slid all the way down to 5.7% in Q2 2017 (see figure below). But it appears that the bottom was reached. From that point, the economy picked up its pace again, with both Q3 and Q4 showing increasing growth rates. However, with so much of the economy operating under the radar, GDP estimates must always be taken with a pinch or two of salt.
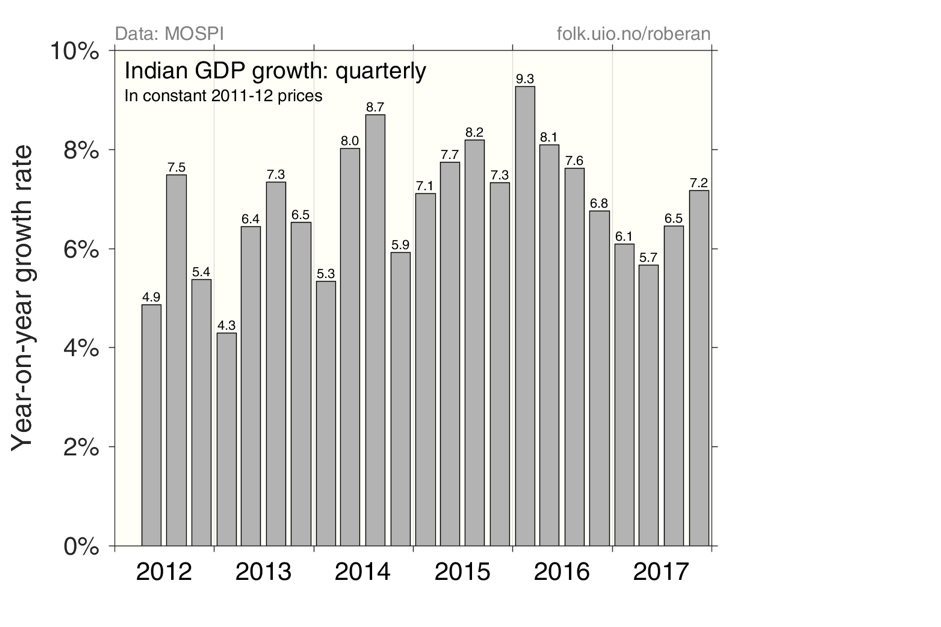
Quarterly GDP growth in India, official estimates. Source: India’s Ministry of Statistics and Programme Implementation.
India’s energy supply
![]()
Energy is an important component of development in every country. How India deliveries that energy over the next two decades will be critical to its emissions trajectory. India’s focus has been on developing coal: greatly expanding mining, facilitating transportation of coal and adding significant coal-fired power generation capacity.
The figure below shows the steep capacity development of grid-connected coal (and lignite) power stations in India, with capacity reaching almost 200GW in 2017, more than doubling since 2007. The figure also highlights the more recent additional focus on non-hydro renewables, which have grown by about a factor of eight over the same period – and by about 30% in 2017 alone.
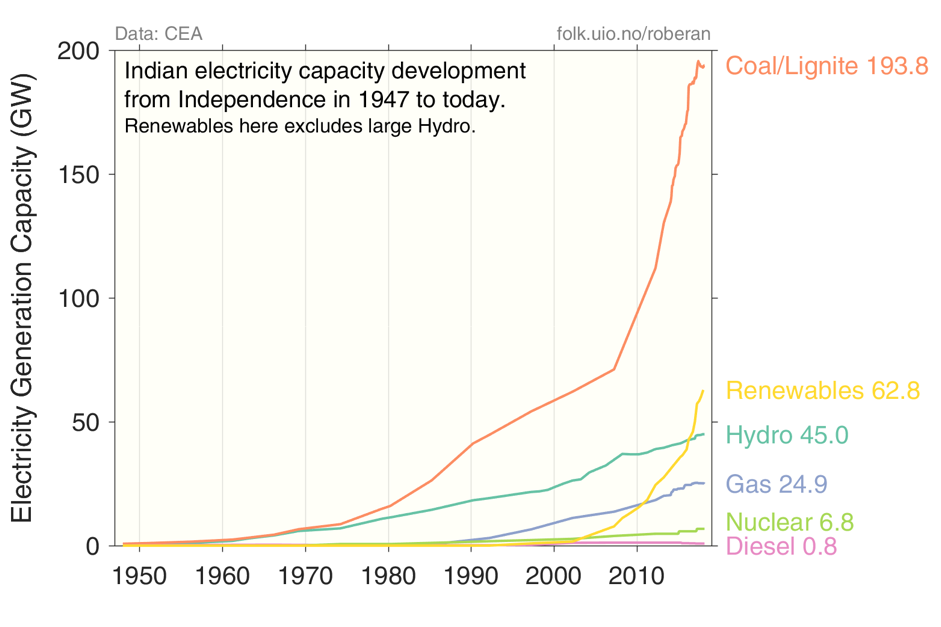
The development of India’s grid-connected electricity generation capacity since Independence in 1947. Source: India’s Central Electricity Authority.
However, this figure exaggerates the current role of renewables in India, since generation is what interests us when we’re considering emissions: how much do renewables actually offset coal?
Renewables in India generate electricity, on average, about 30% of the time, while the figure for coal is about 60%. This is low for coal. The government’s target for coal is 80%.
So while renewables made up 18% of total capacity at the end of 2017 – up from 15% the year before – it contributed only 7.5% of generation for the year. (Gas capacity is also misleading: with very constrained supplies, gas-powered stations in India operate at only 20% of capacity.)
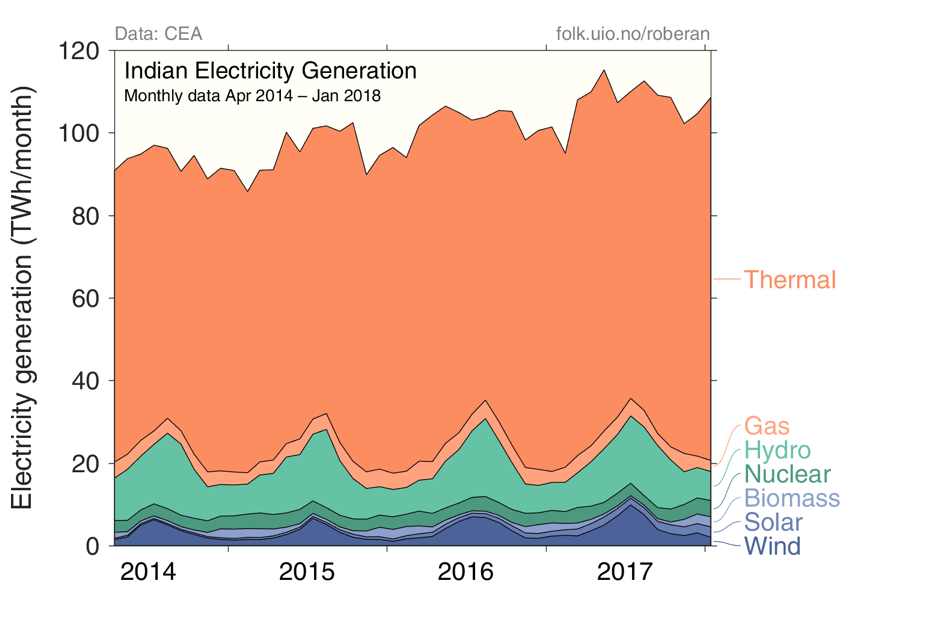
India’s monthly grid-connected electricity generation by type. Both wind and hydro have large seasonal cycles, resulting in the saw-tooth appearance at the bottom. Source: CEA.
But the Indian government has very strong goals for increasing renewables capacity: 100GW of solar, 60GW of wind and 10GW of biomass energy by March 2022. A back-of-the-envelope calculation suggests that, if current capacity utilisation factors are maintained, this combined 170GW could replace about 70GW of coal capacity.
In fact, new coal-fired power capacity additions in 2017 were the lowest in at least nine years (see figure, below), with official reports indicating capacity actually dropping for four consecutive months during the year, as older power stations have been retired. One reason for this slowdown is certainly the recent growth in renewables. But a more important reason, perhaps, is that construction and plans have raced ahead of demand growth.
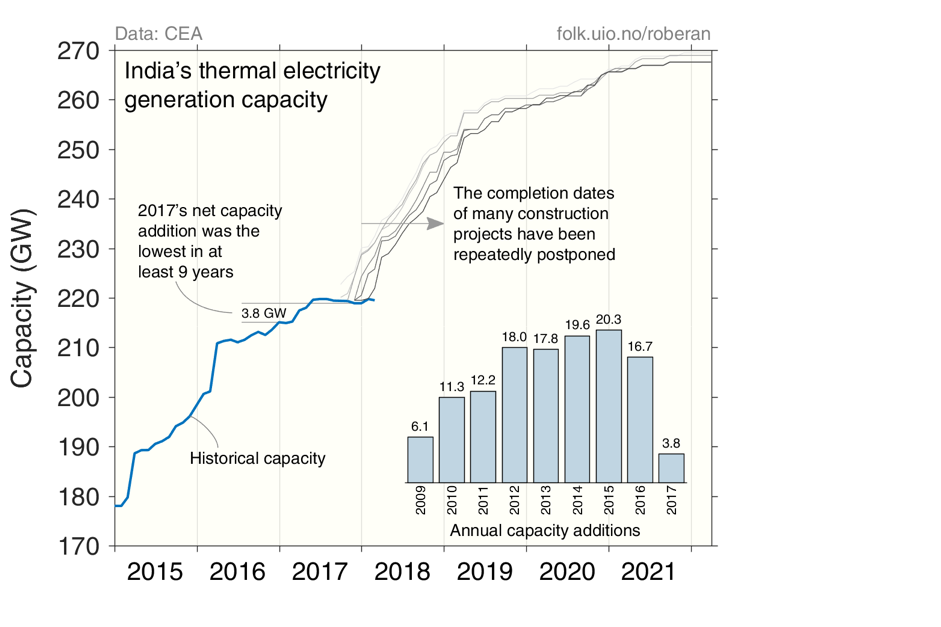
Recent additions to thermal (mostly coal) electricity generation capacity in India, with future capacity additions based on reported expected completion dates of power stations under construction or in planning. Unfortunately, comparable data for renewables is scarce. Source: Central Electricity Authority.
While only 3.8GW of thermal generation capacity was added in 2017, the addition of renewables capacity clocked in at 12.8GW, split approximately one-third wind and two-thirds solar.
According to India’s draft national electricity plan, no new coal-fired stations will be required during 2017–22, with current capacity and projected renewables capacity sufficient to meet demand growth. This result holds for all three of its scenarios of renewable additions.
However, around 50GW is already under construction and planned to be commissioned during that period. If all of that is built, the average load factor of coal-based plants is likely to drop further to about 50%. This is based on assumed annual demand growth of 6.34%; further scenarios with higher growth rates and low addition of renewables capacity do require new coal stations, but still only at most half of those under construction.
Lessons learned
The early projection of India’s 2017 carbon emissions used by the Global Carbon Project was for 2% growth with a range of 0.2%–3.8%. Now that the year has passed and most of the data is in, the same method produces 4.6% growth. As we’ve seen, the clear explanation for this is the unusual nature of 2017.
The uncertainty range is largely derived from looking at how well using the same months of data in previous years would have performed and then selecting the worst case. That the current estimate of 4.6% falls outside of the range of 0.2%–3.8% therefore simply means that 2017 was more unusual than any of the previous years available for analysis in the collated data.
While the projection was poor, the accumulation of all the data required for this analysis is not a wasted effort. We learn a lot about India by making a projection and we can learn a lot from understanding exactly why the original projection was so removed from what actually happened.
It was always obvious that a projection using only data for the first seven months of the year would be much more uncertain than one made later with further months of data. But the fact that having nine months of data still led to a significant underestimate of the full-year growth rate raises some important questions: What are the drivers? Could their trajectories be better forecasted? How much of this is unpredictable “noise” introduced by sudden policy shifts?
Policy direction
![]()
The year 2017 was tumultuous for the Indian economy, but, in fact, looking at data for previous years suggests that steady does not appear to be the norm. It will, therefore, be interesting to see (read: difficult to predict) where India will be in five years’ time.
What we do know is that India has strong goals for renewables. The government also wants to bring electricity to all households and reduce bureaucratic barriers. Additionally, it has put forward a goal of reducing the carbon intensity of its economy by 33–35% between 2005 and 2030.
Let us look briefly at each of these in turn.
India’s Ministry of New and Renewable Energy is very optimistic about reaching the 175GW renewables target before the 2022 target date. But when the government appears to be seriously considering protecting more costly and small-scale domestic production by imposing high import tariffs on imported solar panels – or, at a minimum, reclassifying them as “motors” and imposing a 7.5% tariff – it looks like there are clouds gathering against rapid deployment of solar in the next few years.
That said, there is so much potential in India and pent-up enthusiasm among developers that such hurdles may only temporarily delay the progress of solar. India’s first solar target, announced early in 2010, was 20GW by March 2022. But with rapidly falling prices for solar panels, largely driven by Chinese mass production, the target was raised in 2015 to 100GW.
India’s nationally determined contribution (NDC) under the Paris Agreement targets 40% electricity generation capacity in 2030 from non-fossil sources. But, again, if that capacity averages only 30% utilisation, while fossil sources average 70%, then that is equivalent to only about 22% of electricity generation.
Electrification of all villages and households in India has been a long-term goal. The current government is continuing this drive with substantial investment. In late September 2016, Narendra Modi announced that the existing targets of full electrification of all villages and households in India would be brought forward.
What this will mean for near-term electricity consumption is unclear. First, the distribution companies are often forced to sell power to rural customers at a loss, something which they cope with by restricting sales to rural areas and increasing sales to industrial customers, who are charged a premium. Second, because remaining unelectrified households are largely extremely poor, their electricity consumption is likely to be very low following connection.
One thing the nationwide GST did achieve was the removal of tax checkpoints at state boundaries, which should greatly ease the transport of goods and allow companies to greatly improve logistics. The government’s announcements for ramping up expenditure on infrastructure, especially road-building, are also expected to lead to increased diesel consumption.
As for India’s carbon intensity reduction target, this is seen by some analysts as unambitious and easily achieved. In strong contrast to domestic politics, India may have under-promised on the international stage.
Transparent estimates
The next estimate of India’s 2017 emissions growth rate will be published in June by BP in its annual Statistical Review of World Energy. Then it will be a wait of more than a year before more robust estimates from the IEA will be available, in the second half of 2019, although it has already made as-yet-unpublished preliminary estimates. Both BP and the IEA restrict their estimates to emissions from fossil-fuel combustion, excluding the cement process emissions included in our analysis (see figure below).
India itself does not yet publish timely estimates of national CO2 emissions or growth rates. Its most recent Biennial Update Report to the UNFCCC only provides data for 2010. Earlier this month, India’s own Ministry of Environment, Forest and Climate Change was still using 2010 as its most recent estimate of national CO2 emissions.
One outcome of the Paris Agreement is a process for periodic stocktake and review, to ensure that the global community is on track to meeting the commitments and drive the “ratchetting” of ambition. While the details of this stocktake and review are yet to be resolved, data will necessarily be a core component.
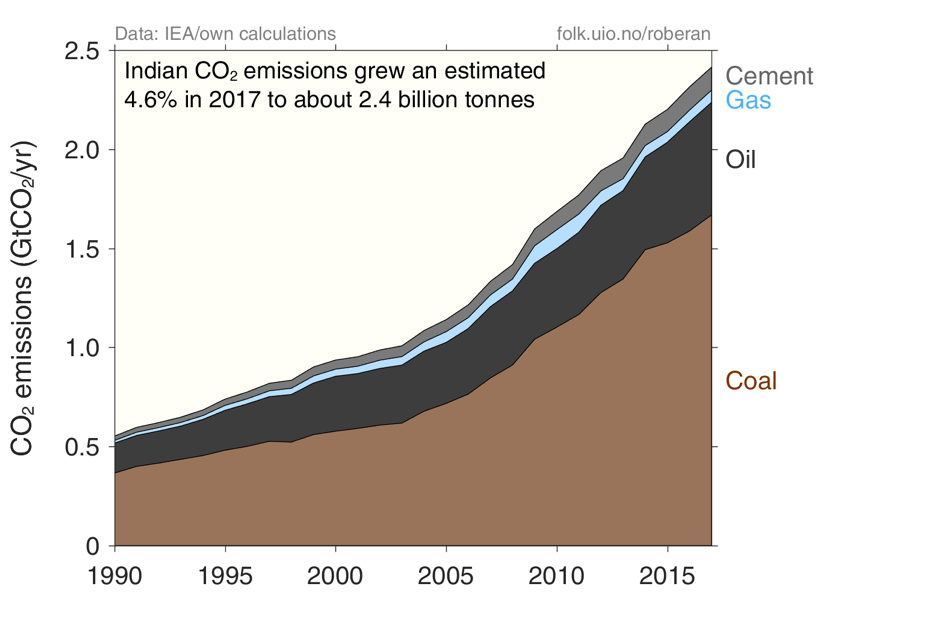
India’s emissions from 1990 to 2017, by major source. Note that the IEA’s emissions estimates differ somewhat from those used by the Global Carbon Project. Source: IEA (to 2015) and own calculations (including cement emissions from Andrew 2018).