Guest post: Why NOAA updates its sea surface temperature record

Prof Peter Thorne
02.10.17Prof Peter Thorne
10.02.2017 | 1:45pmThis is a guest article by Prof Peter Thorne, professor of physical geography at Maynooth University in Ireland, and centre director of the Irish Climate Analysis and Research UnitS (ICARUS).
The National Oceanic and Atmospheric Administration (NOAA) is one of a number of climate agencies that pieces together global temperature from thousands of measurements taken each year across the world’s land and oceans.
Last weekend, an article in the Mail on Sunday sparked interest in the way NOAA constructs its temperature record. The claims in the article, widely rebutted shortly after its publication, focused on the most recent version of NOAA’s sea surface temperature (SST) record.
I have been involved in the development of this dataset since 2011 and it is due to be updated again shortly. However, an early draft of the journal paper about this update appears to have been circulated amongst media without the permission of the authors (including myself).
I have, therefore, decided to make some observations here in a personal capacity that may help make better sense of how the dataset is produced and what it shows.
Peer review
The status of the new version of our dataset – nominally labelled “ERSSTv5” – is that we have submitted a paper to a journal, and it is undergoing peer review.
As is the academic norm, the authors wish to respect the review process and did not give their permission for the draft to be shared with the media. To be clear, the authors have expressly not given permission for the draft to be used or quoted in the media. To be equally clear, at this juncture, copyright of the paper remains with the authors.
The peer review process on the paper has only just begun, therefore it is premature and incorrect to analyse the dataset in detail before the paper is published. Peer review is an essential step towards eventual acceptance of any new research. It is highly unusual – and, in my view, undesirable – to discuss the specifics of submitted manuscripts in a public manner before this process has concluded. Peer review will, inevitably, point out ideas which shall serve to strengthen any given analysis.
I shall, therefore, not be discussing specific scientific aspects of the draft paper and shall refer to it below only to the barest extent required. If and when the paper is published, this will be the appropriate time to discuss its findings in depth and I would be delighted to do so.
This shall also be my (and my co-authors’) position to any follow-up media requests.
However, as we await the formal publication, I am quite happy to discuss the specific challenges of SST analyses, the importance of multiple independent analyses, the value of crowdsourcing portals such as Old Weather, or any of the other fascinating challenges and opportunities that exist in this area.
But, to repeat, I will not discuss specifics of a paper that remains under review as this would breach the ethical code understood and respected by all academics.
Challenges
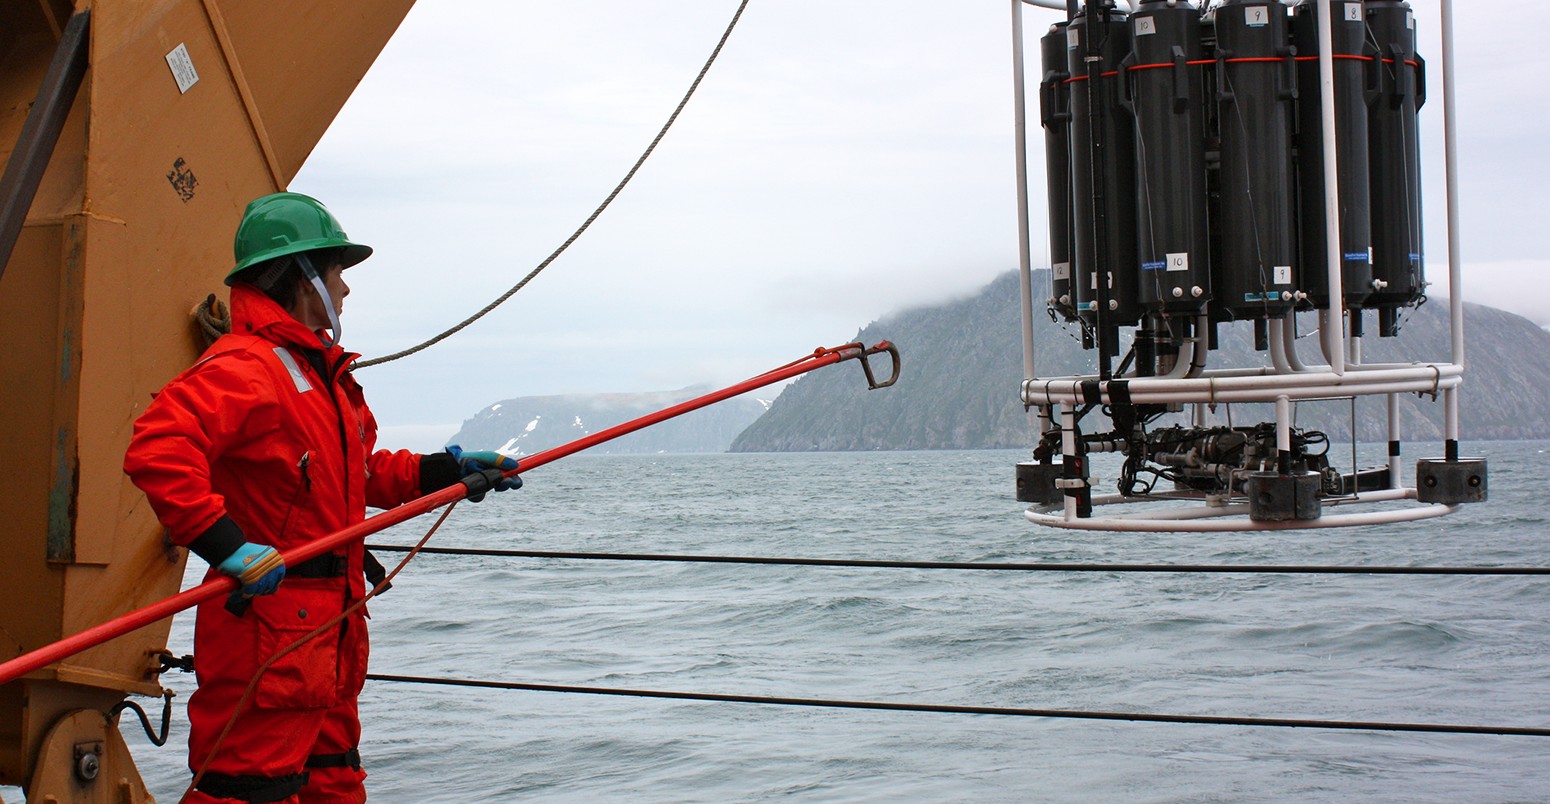
The marine research community has spent several decades collecting a massive set of historical SST measurements, compiled in the International Comprehensive Ocean Atmosphere Dataset (ICOADS). Creating estimates of long-term temperature changes using these original data holdings is a laborious and complex challenge.
Observations over the ocean are generally taken by ships, buoys and profiling floats that often move over very large distances and sea surface conditions. The blend of observations has changed substantively through time in terms of coverage and measurement technique used. You can see this in the figure below.
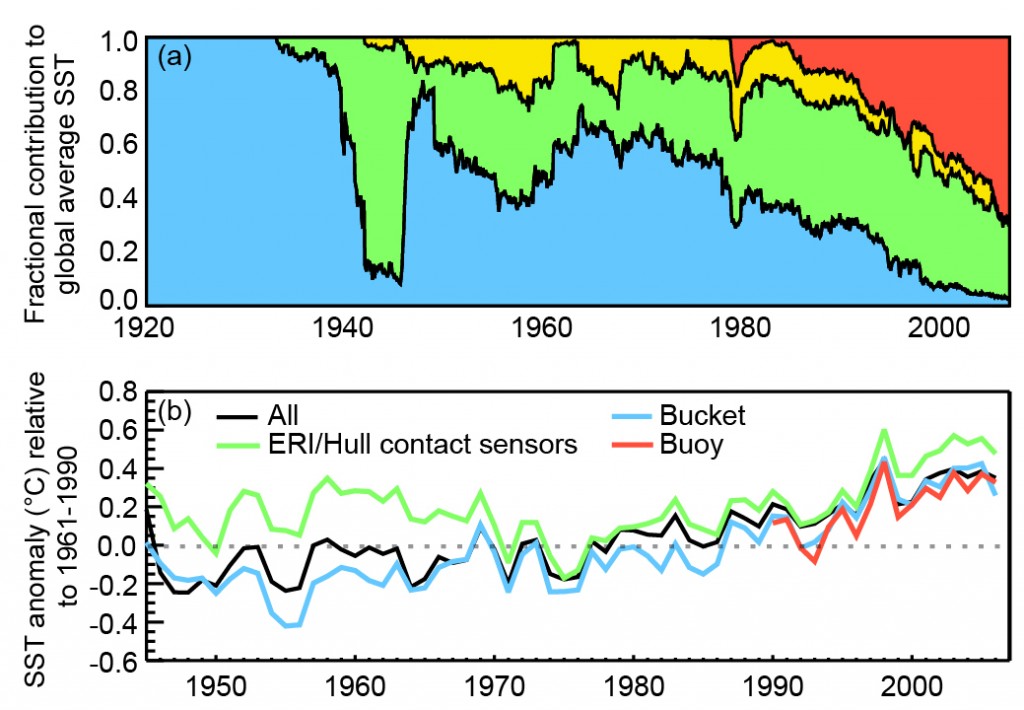
Changing contribution of different measurement techniques (top panel) and their timeseries relative to the average of all sources at any given time (bottom panel). Note large and systematic offsets between distinct sources that vary through time. Source: IPCC
In the 1940s, there was a shift from taking measurements from buckets of water pulled up from ships, to collecting data from from the water that ships use to cool their engines (known as “engine room intakes”).
Failing to take into account these improvements in how measurements are collected would introduce errors into our datasets. The ICOADS timeseries (blue dashed line in the graph below) shows how different our SST records would look if we were foolish enough not to account for these types of changes.
This has the single largest impact on global average SST reconstructions. Without making any adjustments, our estimates would be of the order 0.2-0.3C colder prior to 1940 and we’d almost certainly be (falsely) concluding that 2016 was 1.5C above late 19th century conditions for global mean (land and ocean) surface temperature estimates.
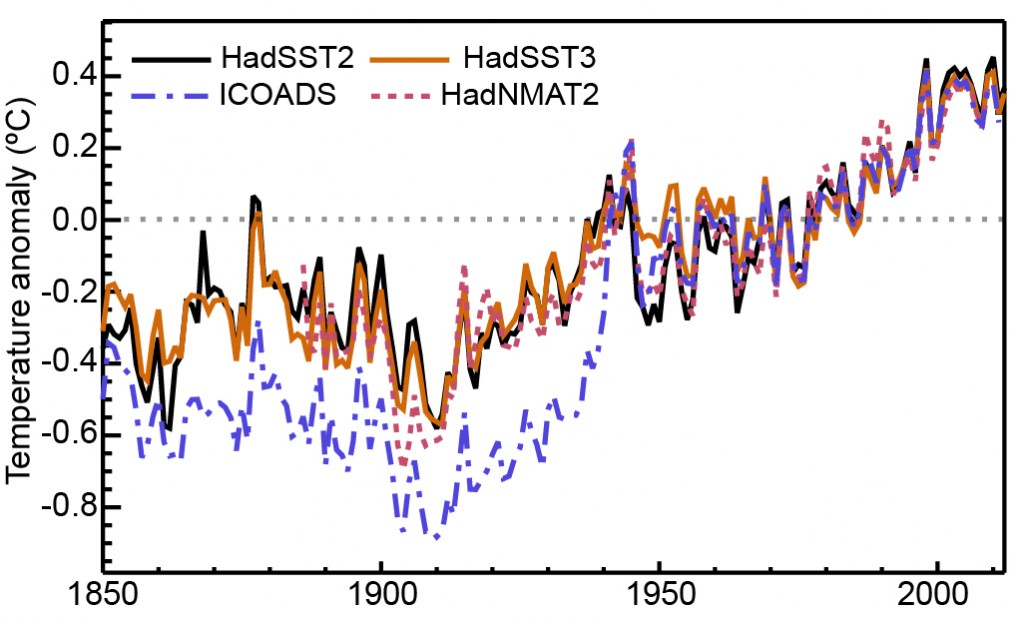
Timeseries of raw marine data (ICOADS) and a subset of corrected Sea Surface Temperature and Night Marine Air Temperatures (remaining lines). Source: IPCC
Why did NOAA decide to revisit SST datasets so soon?
The challenges described above show why it’s so important for scientists to be updating their datasets on a continual basis.
Any dataset that is not being improved is slowly but surely becoming obsolete. We constantly incorporate new data sources, find out new data issues or develop new approaches to data handling problems.
So, this brings us to NOAA’s datasets. In late 2013, version 4 of the SST dataset (“ERSSTv4”) was finalised. Subsequent work on understanding and quantifying the uncertainties in version 4 highlighted a number of improvements we could implement in constructing the dataset.
Furthermore, additional data sources have become available – such as ARGO floats – and a major upgrade in the ICOADS data record that included many new and older data sources and other relevant updates.
The Met Office Hadley Centre also made available a new sea ice reconstruction, which had more realistic natural variability prior to the satellite era. And finally, user feedback provided a spur for potential improvements, particularly in the ability to show local scale features.
So, NOAA took the decision to incorporate all of these new methods and data sources in a “version 5” of the SST dataset. This is the new dataset that will, hopefully, shortly be released following completion of peer review.
What difference might the new version make?
Perhaps the most intuitive way to explore what difference the new dataset may make – subject to completion of the peer review process – is to compare the current and proposed replacement datasets of NOAA with reconstructions from two other leading climate agencies (the UK Met Office Hadley Centre and the Japan Meteorological Agency).
In the figure below, I show globally-averaged timeseries estimates of SST anomalies. The data are smoothed to emphasise year-to-year variability (a process used in many NOAA timeseries datasets).
Three key points to take away here are:
- It is necessary to use a dashed linestyle for version 4 of the NOAA dataset (blue line) so you can tell the difference from the other. This is because the effects of the proposed version 5 (red line) on global average reconstructions is so small that using solid linestyles for both would overlap to the point of being barely distinguishable through most of the series.
- The changes are miniscule in comparison to the differences with the other datasets (black and green lines) produced using entirely independent methodologies.
- Following on from point #2, it is vitally important we continue to refine our estimates and attempt to reduce the ambiguity over historical changes through improved knowledge and improved data holdings including data rescue.
It’s worth noting that the ERSSTv4 and ERSSTv5 series are virtually indistinguishable in recent years and that the comparison does not include the data from 2016. The recent changes that were made for ERSSTv4 are largely untouched in the new version in terms of global average temperature anomalies. Therefore, as currently submitted, ERSSTv5 would not change the bottom-line findings of Karl et al (2015).
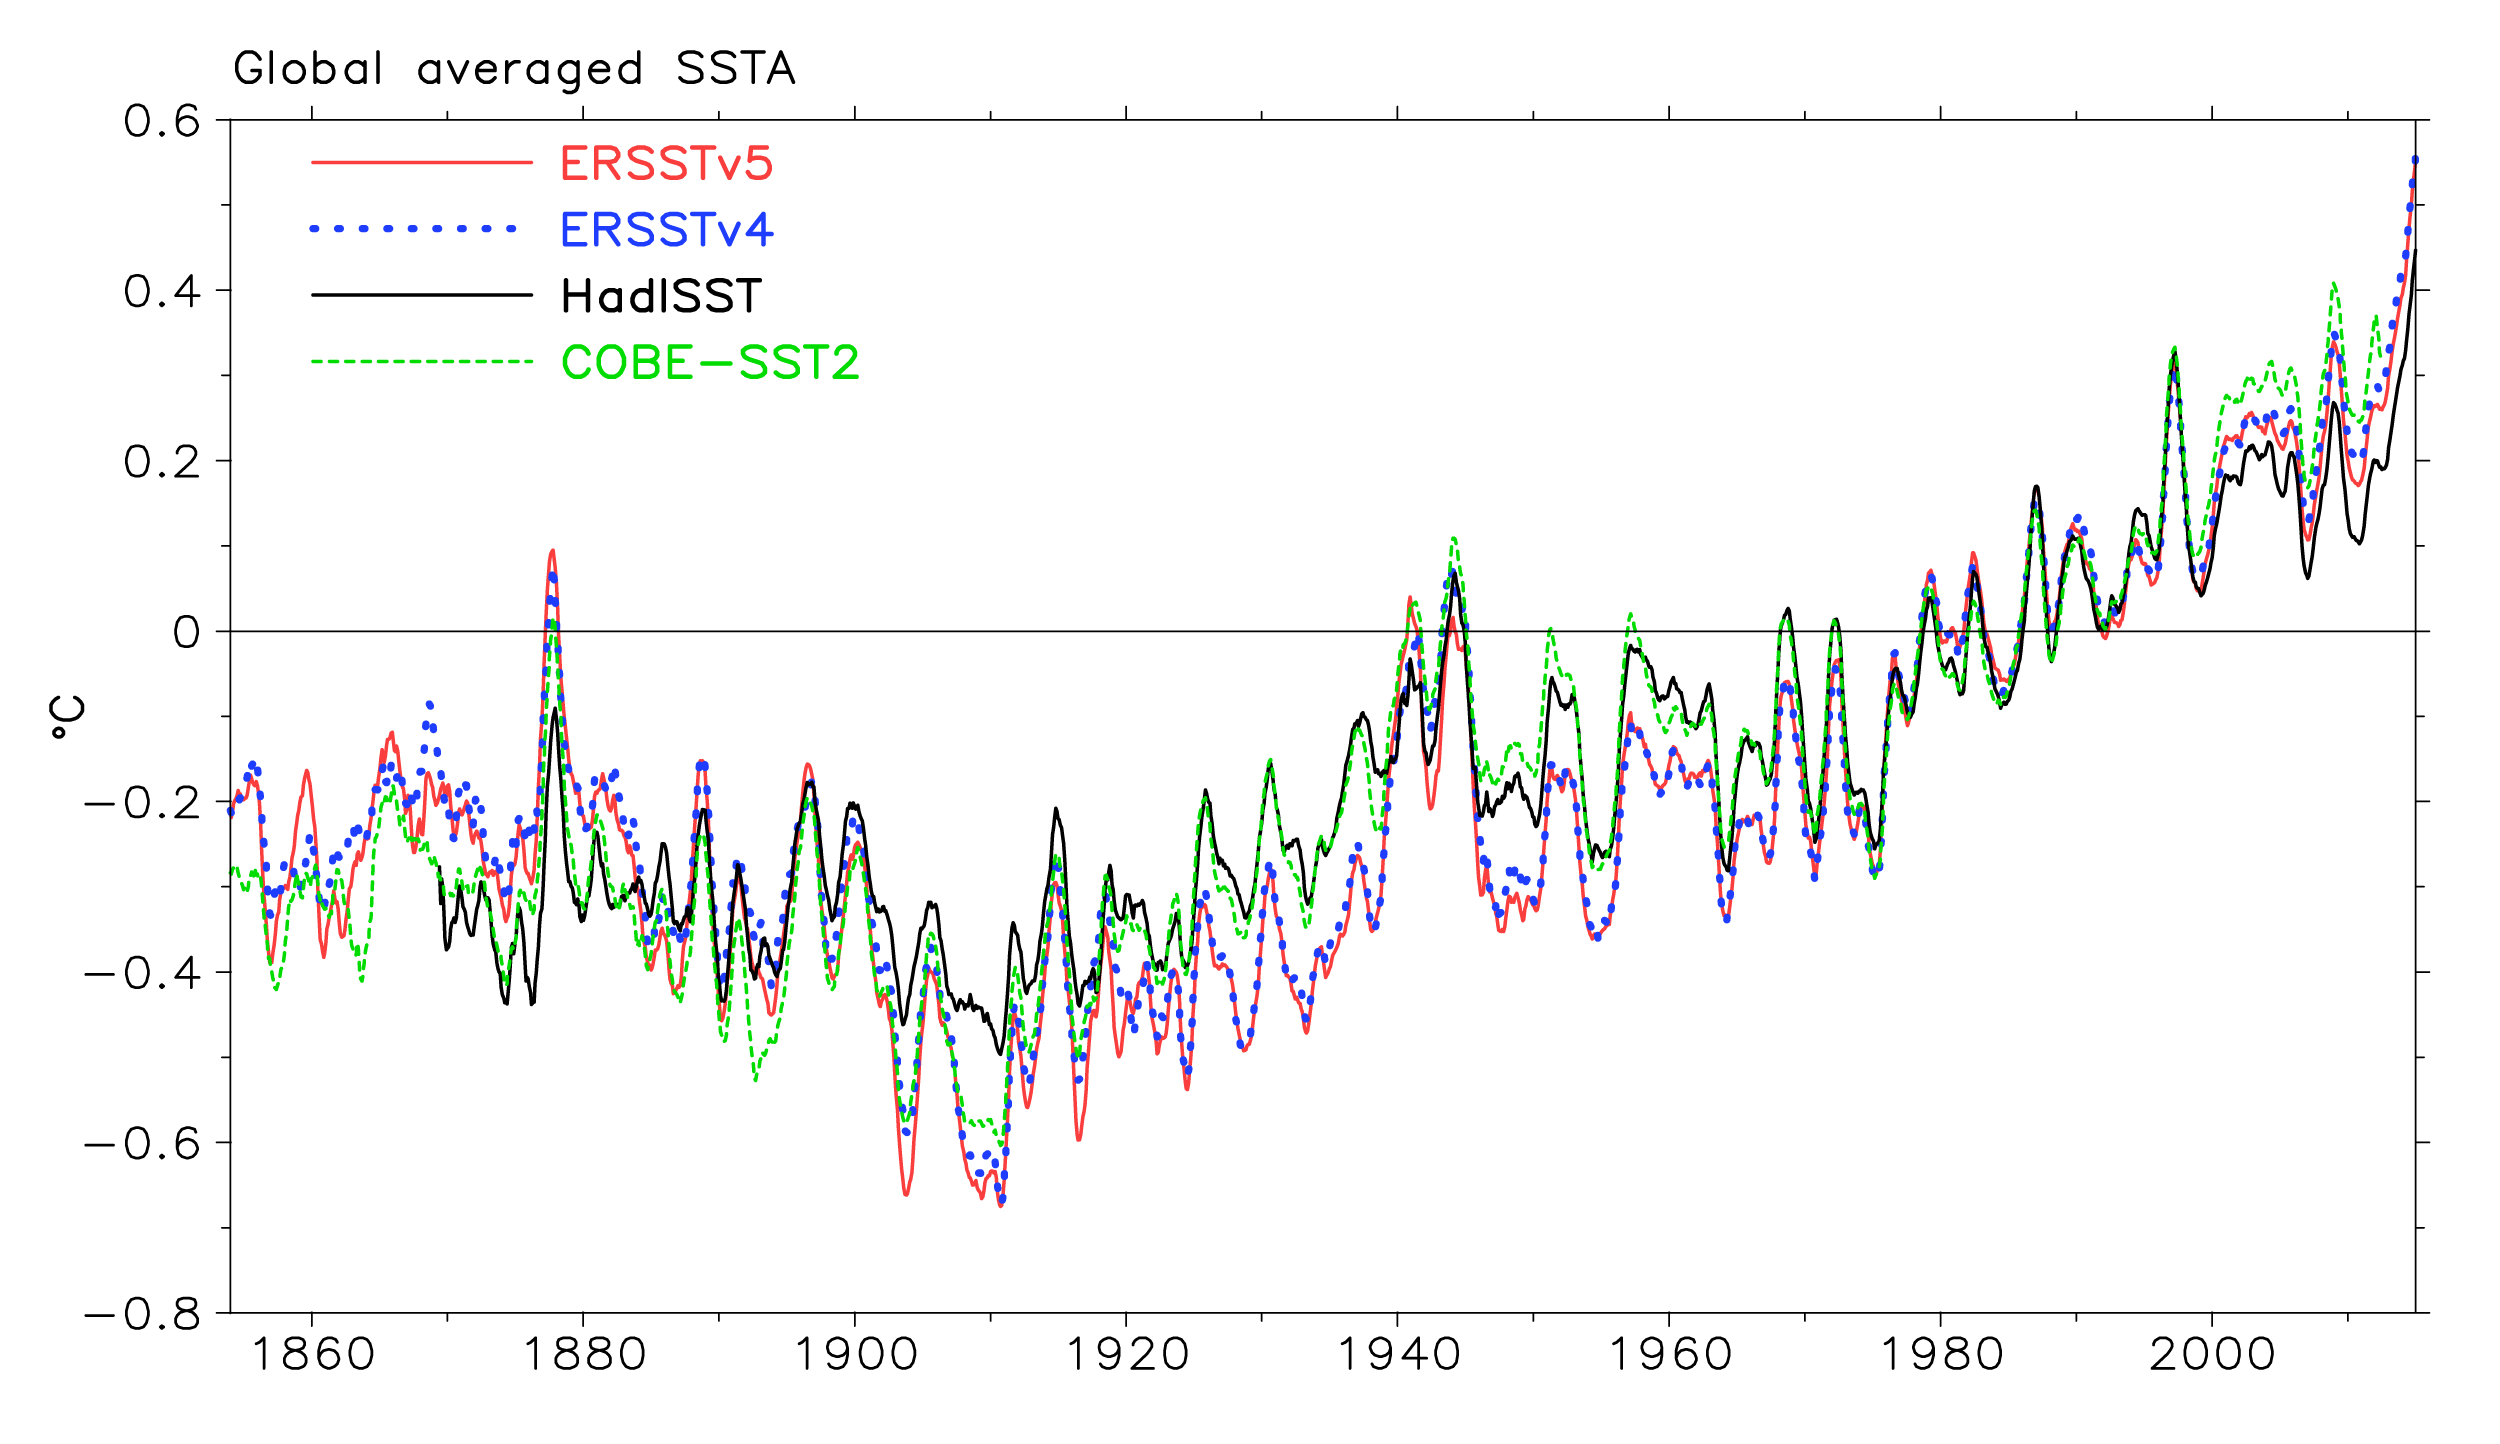
Global averaged SST anomalies from HadISST (black line); COBE-SST2 (green dashed line), the current version of the NOAA dataset (ERSSTv4, blue dotted line) and the under review potential replacement (ERSSTv5, red line). All data uses a common 1971-2000 baseline. I stress again that the ERSSTv5 product is under review and liable to change.
Mundane truth
You may well see hysterical headlines regarding NOAA correcting their datasets in fundamental ways in coming days. The mundane truth is that NOAA are doing what every other dataset provider does which is aiming to continuously reassess and improve their product.
The change in long-term global average timeseries in the proposed new version is barely perceptible when the series are lined up together with the same baseline period, and much smaller than the uncertainties we already know about in the existing dataset (as you can see in the figure below).
If ever there was a storm in a tea cup, this was it. There is no major revision proposed here and anyone who tells you otherwise fundamentally misunderstands the submitted paper draft (which at this juncture should be the sole provenance of the editor and reviewers per the journal’s policy).
We should let peer review complete its course. Then, and only then, we can discuss this new analysis in more depth.
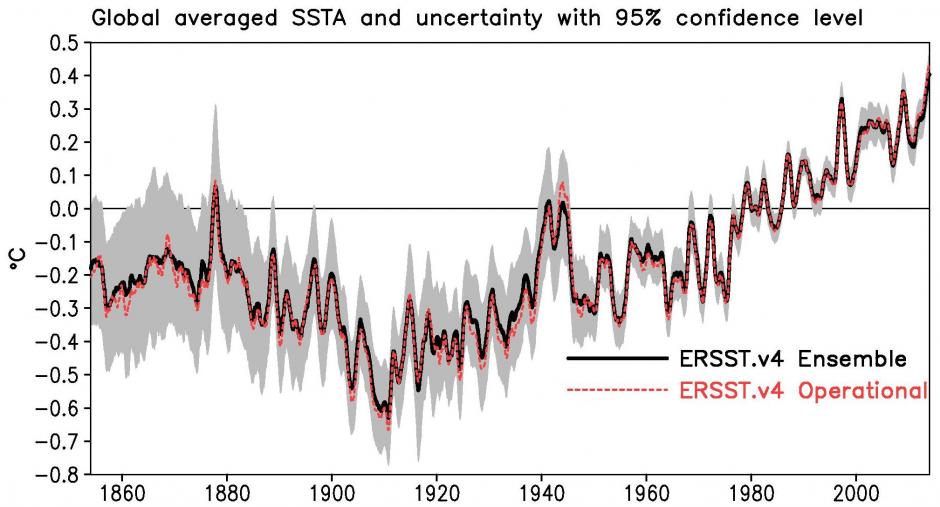
Global averaged monthly SST anomalies from the operational version of the NOAA dataset (ERSSTv4, red dotted line) and the average of one thousand realisations of the method used in ERSSTv4 (black line). The grey shading shows the 95% confidence interval on the ERSSTv4. Source: NOAA