Guest post: Why ocean depth is key for how warming will affect marine life
The world’s oceans are home to more than 240,000 known species, each with specific conditions in which they need to thrive.
However, human-caused climate change is altering the marine environment through changes in temperature, oxygen content and acidity levels, threatening the habitats of these species.
A growing body of research is dedicated to study how these changes will affect the distribution of marine life. Ultimately, ocean temperatures play the largest role in shaping global patterns of biodiversity, according to the thermal tolerance limits of each species.
It is, therefore, possible to track changes in the distribution of marine life by looking at the evolution of ocean temperature. For example, research suggests that invertebrates and fish are shifting poleward as the oceans warm.
And, yet, much of the scientific literature has concentrated on how annual or seasonal temperatures are changing. Similarly, many studies have focused on the temperature at the sea surface because of data availability.
But new state-of-the-art observation systems now give scientists a wealth of information down through the depth of the ocean. In a new paper study, published in Nature Climate Change, we assess how thermal ranges from the surface to a kilometre in depth are changing and what this means for marine life.
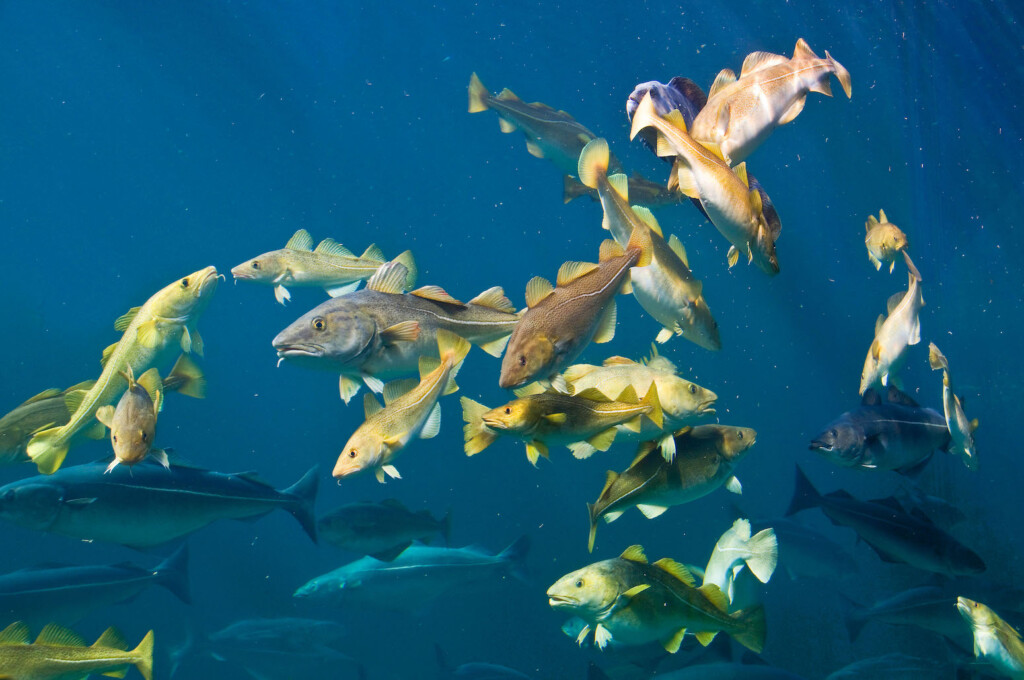
For a species such as the Atlantic cod, a changing thermal range could see it facing a largely “novel” thermal environment this century, depending on future carbon emissions. As a response, it will either need to migrate – polewards or into deeper waters – or adapt to the new conditions. Either option will likely involve new competition for food and new predators to evade as the distribution of marine life in the ocean changes.
Current thermal ranges
Over the past two decades, new observation systems – such as the Ocean Sites network and the ARGO/Bio-ARGO programme – have given scientists an unprecedented view of how the world’s oceans are changing.
The Ocean Sites network, for example, comprises a global system of “long-term, deepwater reference stations measuring dozens of variables and monitoring the full depth of the ocean, from air-sea interactions down to 5,000 metres”.
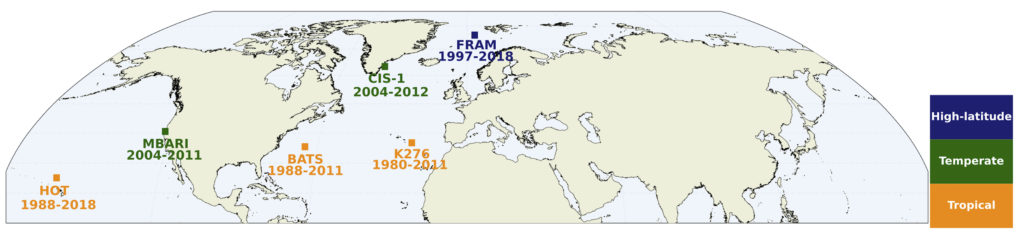
The data from these monitoring stations allows us to produce “vertical profiles” showing ocean temperatures through the depth of the ocean. For our study, we focused on six locations (shown below) across the northern hemisphere – three in the tropics, two in temperate regions and one at high latitudes.
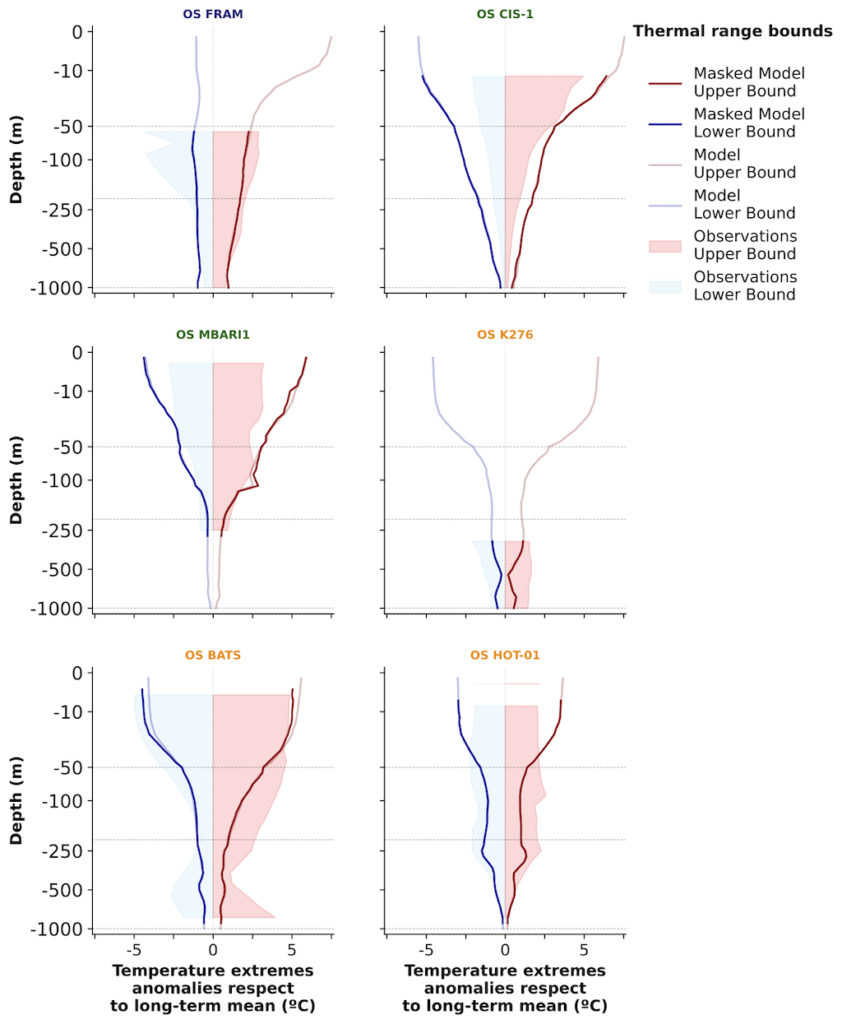
The profiles below show the thermal ranges for the six sites, to 1km in depth, based on observations of the minimum and maximum temperature at each depth and location. The shading and lines indicate the thermal range as informed by the observations and model simulations, respectively. The colours indicate the upper (red) and lower (blue) bounds of the range. We assume that marine organisms are adapted to this current thermal range.
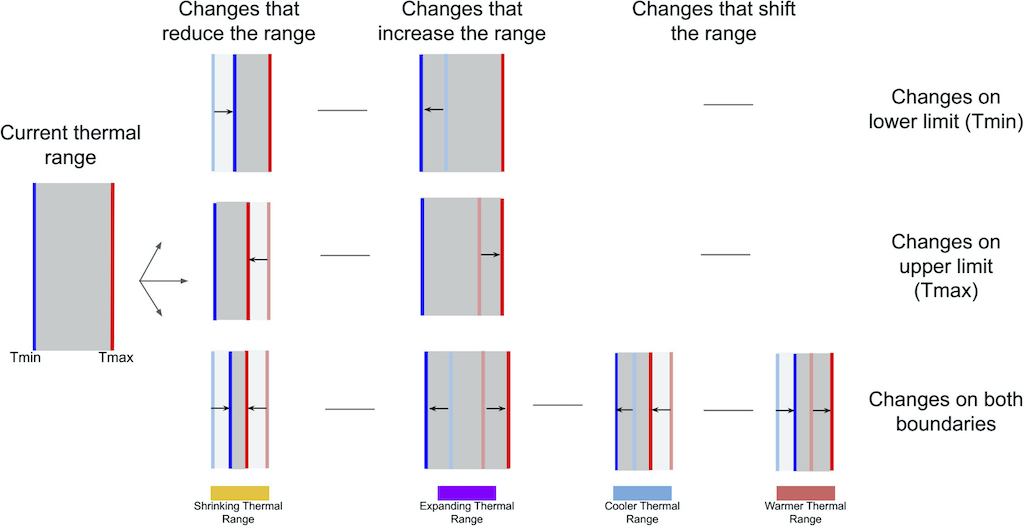
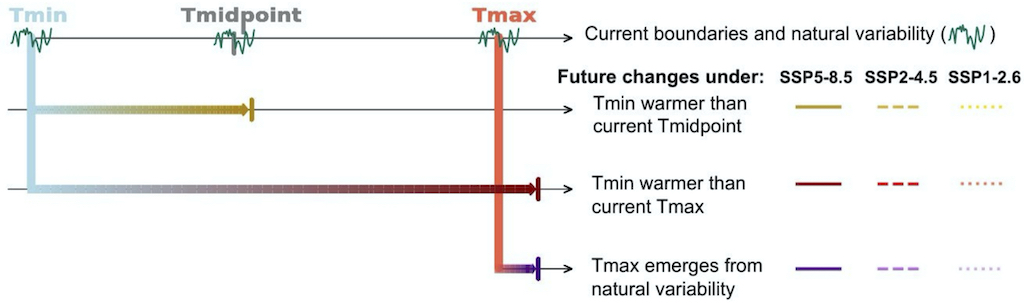
However, as the oceans warm, these thermal range boundaries will change. The figure below shows the different ways they could shift, including changes to the lower temperature limit (top), the upper limit (middle) or both (bottom).
For example, there are several ways in which the thermal range could narrow (yellow bar), such as the lower temperature limit increasing more rapidly than the upper limit. In contrast, the opposite would see the range expand (purple). If both limits decreased, the range would shift into a cooler range (blue), whereas if both increased this would see a warmer shift (red).
Timing of substantial changes
We estimate where and when substantial changes on thermal ranges take place using a modification of the well-known “time of emergence” metric. This identifies when the “signal” of the long-term trend of climate change becomes clear above the “noise” of natural variability.
In particular, we wanted to know when in the future the lower (Tmin) and upper (Tmax) temperature boundaries will cross key current thresholds for marine ecosystems – as the figure below illustrates.
One example is when Tmin crosses the current midpoint temperature (Tmidpoint – the halfway point between Tmin and Tmax), which aligns well with the “maximum ecological success temperature” – that is, the temperature at which the abundance of a given species is at a maximum. At this point, we consider the marine ecosystem to be impacted by climate change.
When Tmin crosses current Tmax, we consider the ecosystem is exposed to a completely new thermal environment, forcing organisms to adapt or migrate. Since organisms are highly sensitive to changes on Tmax, we additionally estimate when Tmax crosses current Tmax.
Our findings show that these developments will occur sooner in “mesopelagic” waters (at 200 to 1,000 metres depth) than in “epipelagic” waters (0 to 200 metres).
Furthermore, our findings indicate the emergence of Tmax from current natural variability will occur as soon as the present decade in waters below 50 metres. However, changes driven by the evolution of Tmin will not appear before the end of this century at this depth level.
Climate ‘novelty’
All these changes will result in shifting thermal ranges at the six sites by the end of the century.
To better see the differences with respect to current thermal ranges, we define a “climate novelty” metric that accounts for the percentage of the end-of-the-century (2080 to 2100) thermal range that has never been experienced with respect to the historical (1990 to 2014) thermal range.
You can see this in the figure below, which shows the projected changes in thermal boundaries for the six sites by the end of the century (red and blue lines and shading), as well as the percentage of climate novelty across oceans depths (purple lines).
On the right-hand side of each chart is a bar to show the expected overall change in thermal range for different ocean depths under three emissions scenarios – a low-emissions scenario consistent with global warming staying below 2C (SSP1-2.6), a scenario approximately in line with the upper end of combined pledges under the Paris Agreement (SSP2-4.5) and a scenario of very high emissions (SSP5-8.5).
You can see that most thermal ranges are expected to warm and expand this century (purple bars) or warm and shrink (yellow bar). In a few cases, thermal ranges are projected to warm (red) or cool (blue).
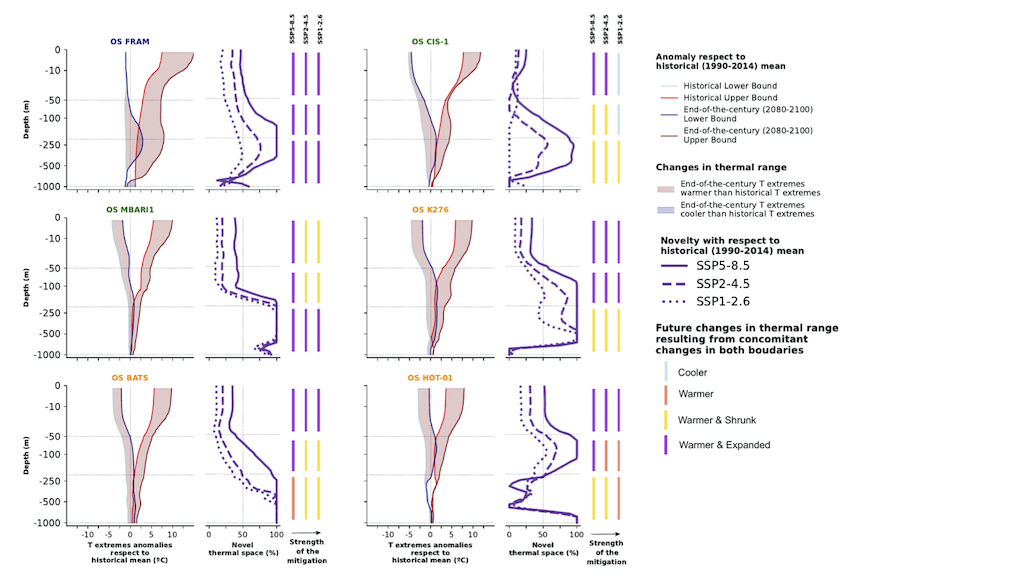
The climate novelty charts show that, under high emissions above 50 metres in depth, all stations presented a climate novelty of around 50%, meaning that half of the thermal range in 2100 would be entirely new relative to the historical thermal range.
This percentage increases to around 100% at several depth levels below 200 metres, indicating that changes in mesopelagic waters will be higher than in epipelagic waters.
Differences across future climates
Our study takes three contrasted emission scenarios, known as shared socioeconomic pathways (SSPs), that describe how society could evolve over this century.
Under the high emission SSP5-8.5 scenario – in which the global average ocean temperature increases by 3-5C by 2100 – the emergence of Tmin crossing current Tmax may appear as soon as the 2040s in mesopelagic waters. The climate novelty of the thermal ranges at the end of the century is close to 100% at this depth level.
This would imply that pelagic species, such as the Atlantic cod – a well-known fish of great economical value as a marine resource – will be challenged by a thermal environment that will be completely different from the current one within just a few decades. As a response, these fish may migrate northwards or deeper, adapting its niche to the novel thermal range, and generating further interspecific competition for food and extra predator-prey interactions with local populations.
When the moderate emission SSP2-4.5 scenario is considered, the emergence of new thermal ranges is delayed by up to several decades, while the climate novelty reduces across the water column, being only of about 100% in few depth levels below 200 metres. If considering this scenario, mitigation plans would give the Atlantic cod additional time to adapt or migrate to more suitable regions.
When reducing emissions to account for the scenario SSP1.2-6 – in which the global average ocean temperature increases by 1-2C by 2100 – the emergence of new thermal ranges is delayed by several years compared to the moderate scenario.
By contrast, the decrease in climate novelty under SSP2-4.5 – compared to SSP5-8.5 – is relevant only at high latitude stations. Despite the delay with respect to higher emission scenarios, marine ecosystem thermal ranges are committed to be impacted even if the world reaches net-zero emissions by mid-century.
On the contrary, differences between emission scenarios are lower when considering the emergence of Tmax. Delayed emergence times of Tmax crossing current Tmax when reducing emissions is mostly observed in upper waters of the temperate and high latitude stations.
Future studies considering vertical dimension
These results imply that marine organisms living in the open ocean will be challenged by changes in their thermal environment even before upper waters undergo substantial changes.
The impacts are particularly concerning for species in regions without the four classic seasons of the year – such as tropical and polar areas – which have a reduced capacity of adapting to elevated temperatures. The emergence of a warmer upper threshold for ocean temperatures will reinforce their vulnerability.
Tropical species may move towards northern latitudes looking for colder waters. But this could put additional pressures on Arctic prey and predators.
Another option is for species to look for thermal refuge at depth, as long as deeper thermal ranges are suitable in terms of higher pressures, reduced light and available food.
Overall, our work suggests that the impacts of climate change to marine ecosystems will be less certain than previously thought. Adding in the vertical dimension reveals a much more complex picture for how marine thermal ranges will change.
Therefore, it is crucial that ocean depths are considered when attempting to study the impacts of a warming world on marine life.
Article information
Santana-Falcón, Y. and Séférian, R. (2022) Climate change impacts the vertical structure of marine ecosystem, Nature Climate Change, doi:10.1038/s41558-022-01476-5