Roz Pidcock
12.05.2014 | 11:00amFrom rising flood risk in the UK to record-breaking heatwaves across Australia, elevated greenhouse gases mean we’re seeing warmer and wetter extremes in our weather than a century ago, says Dr Markus Donat.
Markus Donat researches extreme weather at the Centre of Excellence for Climate System Science and the Climate Change Research Centre at the University of New South Wales, Australia.
1. What type of weather events do you look at, and how do you define “extreme”?
My work focuses on temperature and precipitation extremes. In both cases, “extreme” means particularly high and particularly low values, compared to the expected range in a given region.
That means we look at peak temperatures and heat waves, as well as cold spells. For precipitation, “extreme” can mean unusually heavy rainfall over a single day or over several consecutive days. Unusually long periods without any rain are also a type of extreme event.
2. How do scientists measure extreme heat and rainfall events? How good is the data?
We’ve been working on creating a global database of observations, which means overcoming several big challenges. One issue is data gaps. We have very good observational coverage in the northern hemisphere and in Australia, for example, but large gaps in Africa and South America. Sometimes data exists in written archives, but has never been digitised.

Dr Markus Donat researches extreme weather at the University of New South Wales, Australia.
Data quality is also an issue. Observational data comes from weather stations in different parts of the world. But in many developing countries, the records aren’t always complete. Extreme events happen on the scale of a single day, so any gaps in the record could completely miss them. Instruments might change at a particular station, or the station itself might move. Our goal is to fill these gaps and at the same time to help locals improve the quality of their data.
One thing we’ve done to standardise data from different countries is to develop a set of 27 official indices, which are fairly simple measures of extremes based on daily temperature data and precipitation totals. One example might be the frequency of events in the highest and lowest ten per cent of the distribution. Another is the temperature on the hottest day of the year, or the duration of heatwaves.
3. What changes in extreme events have you observed?
For temperature, it’s a very clear and consistent picture. We see an intensification of heat extremes in most regions of the globe – that means they’re more frequent and more severe. There’s also a fairly robust trend towards less frequent and less severe cold extremes in most regions of the world. This is all consistent with a warming trend in global average temperature.
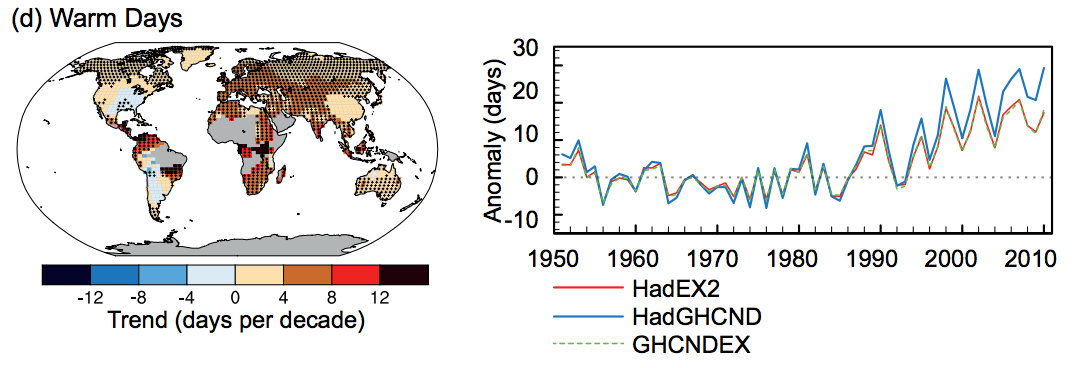
The trend in annual frequency of warm days (defined as number of days in the warmest ten per cent of the temperature distribution) Source: IPCC 5th Assessment Report (AR5) chapter 2, p210
In March, we published a paper as part of a Nature Climate Change special issue on the so-called “pause” in global average surface temperature in the 15 years. We showed that hot extremes and heatwaves have continued to rise over this period – you don’t see any kind of hiatus or pause. And it’s these events that are perhaps most important in terms of impacts.
The picture is more complicated for precipitation, however. Rainfall extremes are much less spatially consistent than temperature. On a global scale, the important message is that we’re seeing more regions with significant trends towards wetter conditions than drier conditions. That means the global average is towards an intensification of precipitation extremes, even though on a local scale there are also some regions where precipitation decreases.
4. How much of the changes you’re seeing can you attribute to climate change?
Attributing clear causes depends very much on the spatial scale of the data and which parameter you’re looking at. For temperature extremes, there’s only a small amount of variability or “noise” compared to the strong warming signal, so it’s quite easy to identify significant trends and to attribute them to rising greenhouse gases in the atmosphere.
Similarly, the intensification of precipitation extremes on a global scale can be robustly attributed to increasing greenhouse gases and related warming of the atmosphere. But the more fine-scale you get, the more noise you see in the data. So the trend is less robust in a statistical sense, making attribution of rainfall extremes on a regional scale more challenging.
5. Can your work tell us anything about flooding and drought?
Drought and flooding are far more complex pictures than our data can cover. As well as rainfall, flooding risk depends on conditions such as how saturated the ground is already, for example.
The main problem with monitoring the occurrence of drought is the definition. The term “meteorological drought” refers simply to the absence of rain. But evaporation caused by high temperature intensifies the lack of water. So it’s a much more complex and less standardised exercise to clearly observe and measure drought and flooding in a globally consistent way.
6. What advice would you offer people to help understand changes in extreme weather?
When we have an extreme event, the question is always “is this climate change?” Of course it’s more difficult than that, but “single event attribution” is a rapidly developing field. That means seeing where a particular event – like the UK’s exceptionally wet winter last year – lies within the climate variability, and working out how much more likely it is in a warming world.
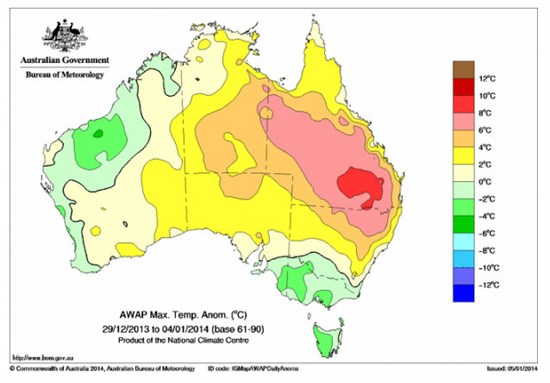
In summer 2013/4, parts of Australia were several degrees warmer than the local long term average. Source: Australian Government Bureau of Meteorology special report.
Last year in Australia broke many records. It’s been the warmest year on record, with many consecutive months with record high temperatures. With an event this extreme, attribution studies are able to say it wouldn’t have been possible at all without some anthropogenic warming. The more the world warms, the more we’ll see this sort of very clear attribution.
We should still expect to see natural variability, however. Those “ups and downs” are just happening on a higher level now. That means it’s still possible for cold extremes to occur, but the trend is for more frequent and hotter extremes as greenhouse gases continue to rise.