IPCC: Six graphs that explain how the climate is changing
Freya Roberts
09.27.13After a week spent meticulously agreeing the exact wording, the Intergovernmental Panel on Climate Change (IPCC) has just released a summary of the first part of its major report reviewing the science of climate change.
Known as the ‘ Summary for Policymakers‘ (SPM), the document describes the physical science behind climate change – whittling down the latest findings about how and why earth’s climate is changing to just 36 pages.
It also makes predictions about how temperatures and sea levels might change in the future – relative to their average levels between 1986 and 2005. The two main ones we’ll touch on here are RCP2.6, a low emissions scenario where carbon emissions are rapidly cut, and RCP8.5, a high emissions scenario with no carbon cuts.
But who can be bothered to read a 36 page document? So here are 6 pictures (okay, graphsâ?¦) to give you the gist.
The amount of carbon dioxide in the atmosphere is rising:
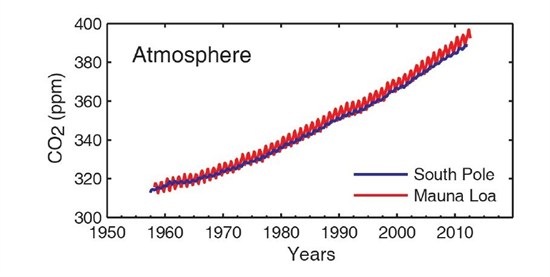
Measurements show the concentration of carbon dioxide in the atmosphere has risen. Since pre-industrial times, carbon dioxide levels have increased 40 per cent. The biggest cause of the increase is fossil fuel emissions, while land use changes – for example turning forest into farmland – are the second biggest cause.
The earth’s surface is warming:
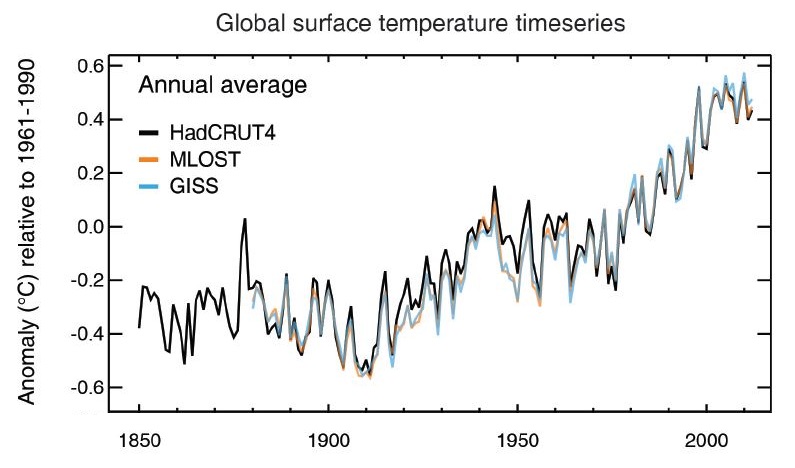
Between 1880 and 2012, earth’s surface has warmed by approximately 0.85°C. Surface temperatures fluctuate substantially, and warming has naturally occurred more slowly in some decades that others, but data collected by a number of scientific institutions confirms a long term warming trend.
Arctic sea ice is melting:

The amount of ice left at the end of the summer melt season in the Arctic is shrinking. The area of ice covered ocean – also known as sea ice extent – has shrunk by between 3.5 and 4.1 per cent per decade since satellite records began in 1979. The change in summer months has been particularly strong, with ice extent decreasing 13 per cent per decade.
Earth’s surface will continue warming:
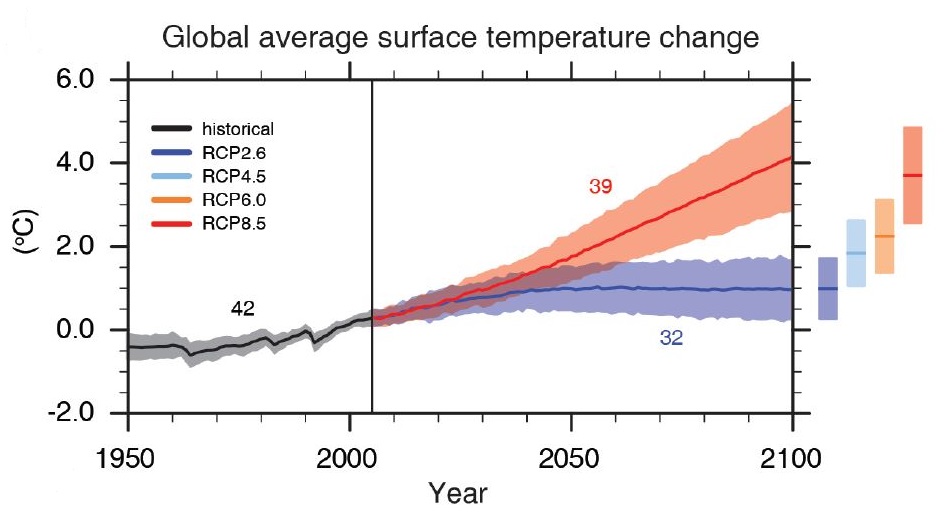
The report predicts that surface temperatures will continue to rise. Depending on the amount of greenhouse gases produced in the future, temperatures could rise by as little as 0.3°C or as much as 4.8°C. The mean temperature rise predicted under the IPCC’s low emissions scenario (RCP2.6) is 1°C by 2100. But remember! That’s a scenario where we cut emissions aggressively.
Under a high emissions scenario (RCP8.5) where emissions continue to grow, 3.7°C of warming is likely.
Sea levels will rise:
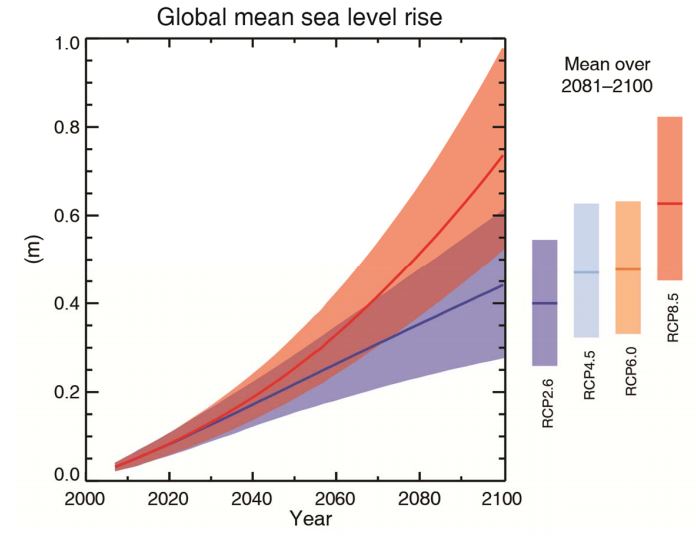
Sea levels are predicted to rise as glaciers and ice sheets melt, and ocean water warms and expands. By the end of the century, sea levels are likely to rise by between 26 and 82 centimetres (cm). The mean sea level rise predicted under the IPCC’s low emissions scenario is 40cm, while a high emissions scenario could result in an average of 63cm of sea level rise.
Rainfall patterns will change:
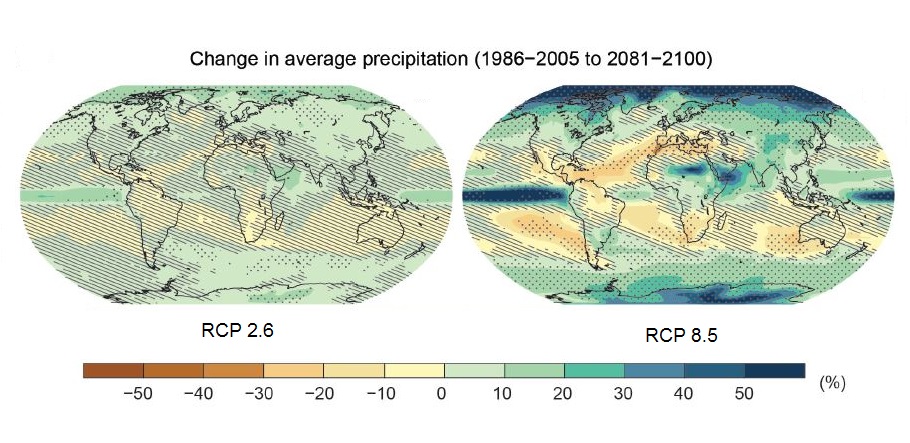
Rainfall patterns are expected to change by the end of the century, with wet regions getting wetter and dry regions getting drier (generally speaking). Under a low emissions scenario this contrast is likely to be less obvious. But under the high emissions scenarios, some places will receive up to 50 per cent more rainfall, while others receive up to 30 per cent less.
There’s more to it
These are just a few of the new report’s findings. The extra heat being trapped as a result of human activities is causing glaciers and ice sheets to melt, the oceans to warm and expand, it’s changing extreme weather events, leading to hotter hot days fewer cool nights.
How these impacts continue to take effect over the 21st century very much depends on whether or not greenhouse gas emissions can be curbed, the report concludes.
Found this useful? Sign up to our daily update, or follow us on twitter.