Mangrove deforestation emits as much CO2 as Myanmar each year
Robert McSweeney
02.26.18Robert McSweeney
26.02.2018 | 4:00pmThe world’s mangrove forests, with their archetypal twisted roots protruding from the water surface, store more than 4bn tonnes of carbon, new research shows.
But deforestation – often to make way for fish farming – has seen the global area of mangroves decline by 2% between 2000 and 2012.
The amount of carbon released through clearing mangroves amounts to 24m tonnes of CO2 per year, the research finds – equivalent to the annual emissions of Myanmar.
The study, published in Nature Climate Change, presents a global dataset of mangrove carbon stocks at national, regional and local scales. This will allow officials, researchers and non-governmental organisations (NGOs) to monitor the “loss rates for their site of interest almost anywhere globally”, the lead author tells Carbon Brief.
Blue carbon
“Mangroves” is the name given to the tangled mix of trees and shrubs found in coastal waters across the tropics and subtropics. They are most easily identified by their elongated roots, jutting out of the water and holding themselves steady in the loose, muddy soil.
Mangroves are unusual as they can cope with salty conditions, thriving despite a twice-daily flooding from incoming tides. Their roots filter out freshwater from the saltwater they live in. The unwanted salt is then excreted through pores in the mangrove’s waxy leaves.
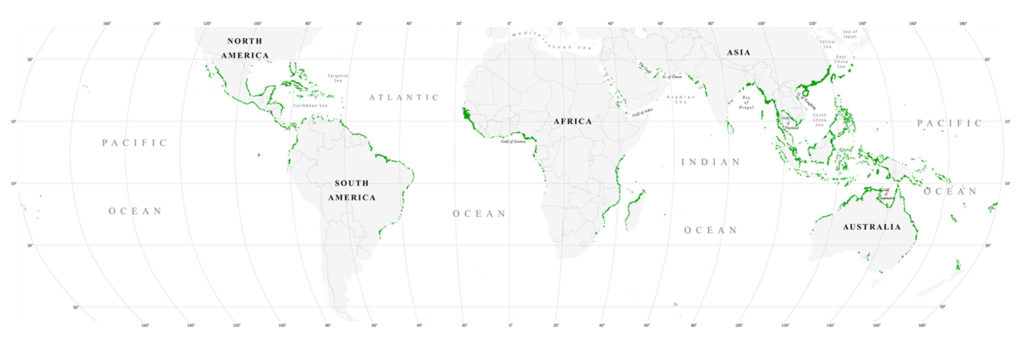
Mangrove forest distribution and dynamics (1975-2005) of the tsunami-affected region of Asia. World map of mangrove distribution. Giri, C., Z. Zhu, L.L. Tieszen, A. Singh, S. Gillette and J.A. Kelmelis. 2008. Journal of Biogeography 35: 519-528. Credit: Wikimedia Commons.
Forests of mangroves are one of the world’s principal stores of “blue carbon”, a term given to carbon accumulated in coastal or marine ecosystems. Other stores include salt marshes, seagrass beds and tiny organisms that live on the seafloor.
Per unit area, mangroves can store up to four times as much carbon as land-based forests. This is partly down to their tidal environment, with the trees accumulating sediment between their roots as the tide rises and falls.
The salty water also means that mangroves drop their leaves constantly, explains lead author Dr Stuart Hamilton, associate professor of geography and geosciences at Salisbury University in Maryland. He tells Carbon Brief:
“Creatures such as crabs are effective buriers of the [leaf] litter and then the conditions – hot, humid, wet – are ideal to breakdown the material. The soils below mangroves are often thick, organic, peat-like mud. It can be many metres thick in some locations.”
You can see how the carbon stocks varies between types of forests in the chart below, from a 2001 Nature Geoscience paper. The bars are divided between the carbon stored below ground in roots and soils (grey and grey with hatching) and above ground in trunks and leaves (white).

Comparison of mangrove carbon storage in the Indo-Pacific with averages for other major global forest types. Figures divided between carbon above-ground (white), in soils and roots to 30cm in depth (grey, hatched) and in soils below 30cm (grey) in millions of grams per hectare. Source: Donato et al. (2011)
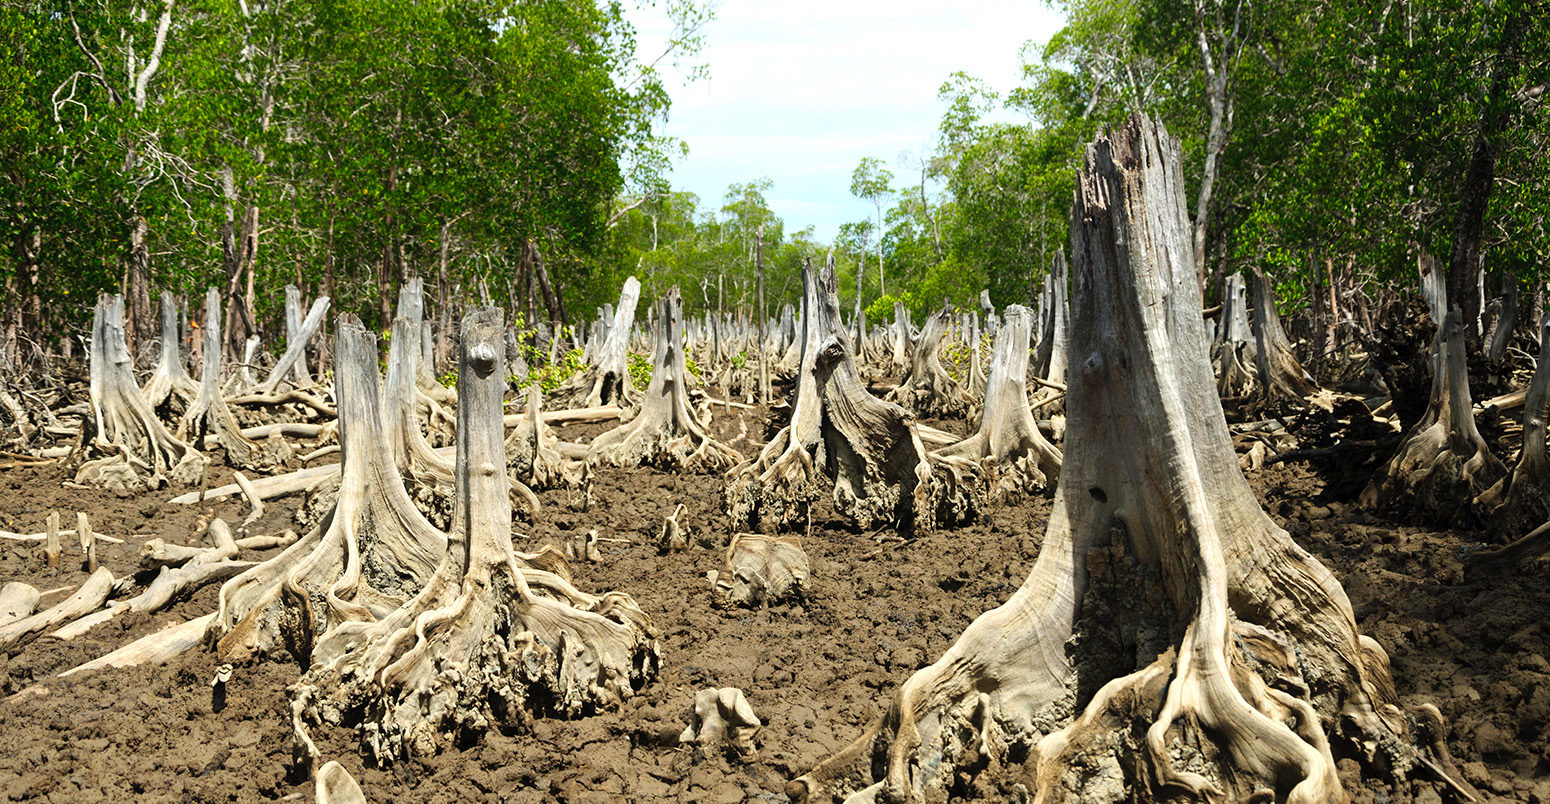
But as with many forests around the world, mangroves are also threatened by deforestation. They are often cleared to make way for aquaculture, fish, shrimp and seaweed, says Hamilton, or the wood is wanted for charcoal or as a building material. The very interior of mangroves are also sometimes cleared for palm oil plantations, he adds.
With their substantial carbon storage, cutting down mangroves has a considerable climate cost. In Indonesia, for example, recent estimates suggest that stopping mangrove deforestation would reduce the country’s land-use emissions by 10-31%.
The new study provides estimates of the carbon stored in mangroves across the world. The authors are making their spatial dataset available for other researchers to “track changes in mangroves carbon stocks at global, national and sub-national scales”.
Global datasets
Despite disliking the term “big data”, Hamilton describes his study as a “big data synthesis approach” to pulling together multiple satellite datasets. He explains:
“We take at least five different global datasets since 2000 that focus on forest cover, mangrove cover, and land cover and combine these into a single product.”
Using this data, the researchers calculated the carbon stock of mangroves on a global grid, with cells as small as 900 square metres at the equator. They do this by first estimating the above-ground carbon stocks, extrapolating the figures for below ground and then adding in a separate estimate of soil carbon from an existing database.
The study estimates that the total amount of carbon held in the world’s mangroves is around 4.2bn tonnes. If this whole amount were released as CO2, it would be equivalent to the annual emissions of China and the US put together.
Of the 4.2bn tonnes total, around 3bn tonnes is within the soil (down to a depth of one metre) and the remaining 1.2bn in the vegetation above the ground.
The largest mangrove carbon stores are in Indonesia, Brazil, Malaysia and Papua New Guinea, which make up half of the global total. You can see the Top 20 in the table below.
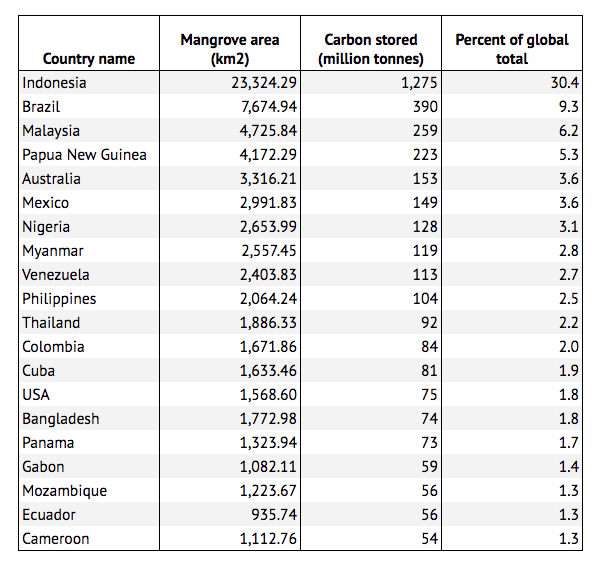
Top 20 national totals of mangrove carbon stocks, 2012. Source: Hamilton & Friess (2018)
Deforestation
Between 2000 and 2012, clearing of mangroves across the world has reduced their total carbon storage by around 2% – or by as much as 86m tonnes of carbon.
In terms of CO2, this amounts up to 320m tonnes – equivalent to the annual CO2 emissions of Poland. Per year, CO2 emissions from mangrove deforestation are around 24m tonnes, or roughly the annual emissions of Myanmar.
Losses of mangroves have been consistent over the 13-year period, the researchers say, at a rate of around 0.17% a year.
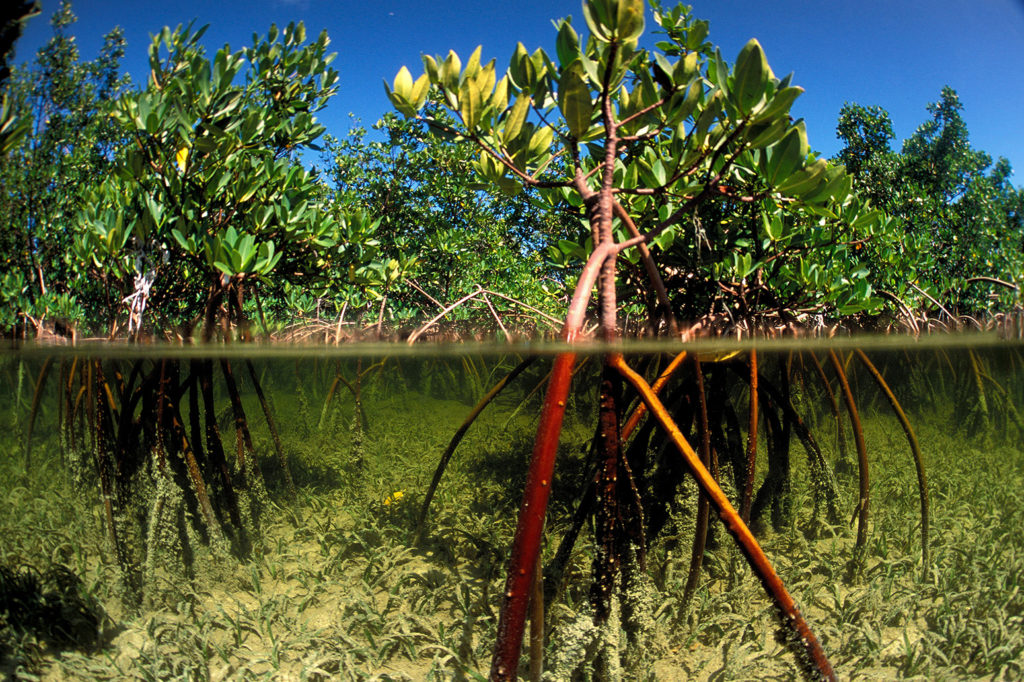
Red mangrove Rhizophora stylosa Bimini Atlantic Ocean. Credit: Mark Conlin / Alamy Stock Photo.
As well as emitting CO2 when mangroves are cleared, once they are gone, they can no longer take up carbon in future. Over the 2000-12 period, clearing mangroves meant that there was a missed opportunity to take up another 4.5m tonnes of carbon over than period. The lost sequestration potential occurs “in perpetuity”, the paper notes.
The amount of mangrove deforestation varies considerably between countries. Indonesia, for example, is responsible for almost half of the carbon storage lost. In general, south-east Asia is a “hotspot of global mangrove carbon stock losses” over the 2000-12 period, the paper says.
The study also identifies mangrove carbon stocks down to the “level one” administrative level – equivalent to state-level in the US, or the different regions of the UK, for example. This reveals the particular parts of each country where mangroves are concentrated. The table below shows the Top 10 of these administrative regions for mangrove carbon stocks.
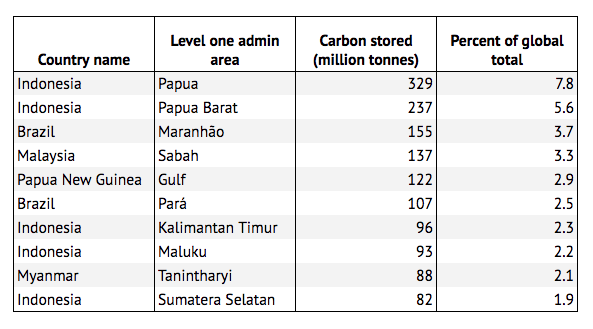
Top 10 administrative level one mangrove carbon stocks, 2012. Source: Hamilton & Friess (2018)
As mangroves tend to be managed on a local or regional level, rather than a national one, being able to identify specific areas at risk from deforestation is critical, says Hamilton:
“What is new and novel is scale. This study gives those managers, researchers, citizens and NGOs a chance to process the carbon stocks and loss rates for their site of interest almost anywhere globally.”
Hamilton, S. E. and Friess, D. A. (2018) Global carbon stocks and potential emissions due to mangrove deforestation from 2000 to 2012, Nature Climate Change, doi:10.1038/s41558-018-0090-4