Mapped: How China dominates the global wind energy market
Simon Evans
04.19.16Simon Evans
19.04.2016 | 3:00pmChina now dominates the global wind energy market, building half the capacity added last year and hosting a third of the cumulative world total.
Carbon Brief has mapped data from the Global Wind Energy Council’s annual status report to illustrate how the wind energy market is changing.
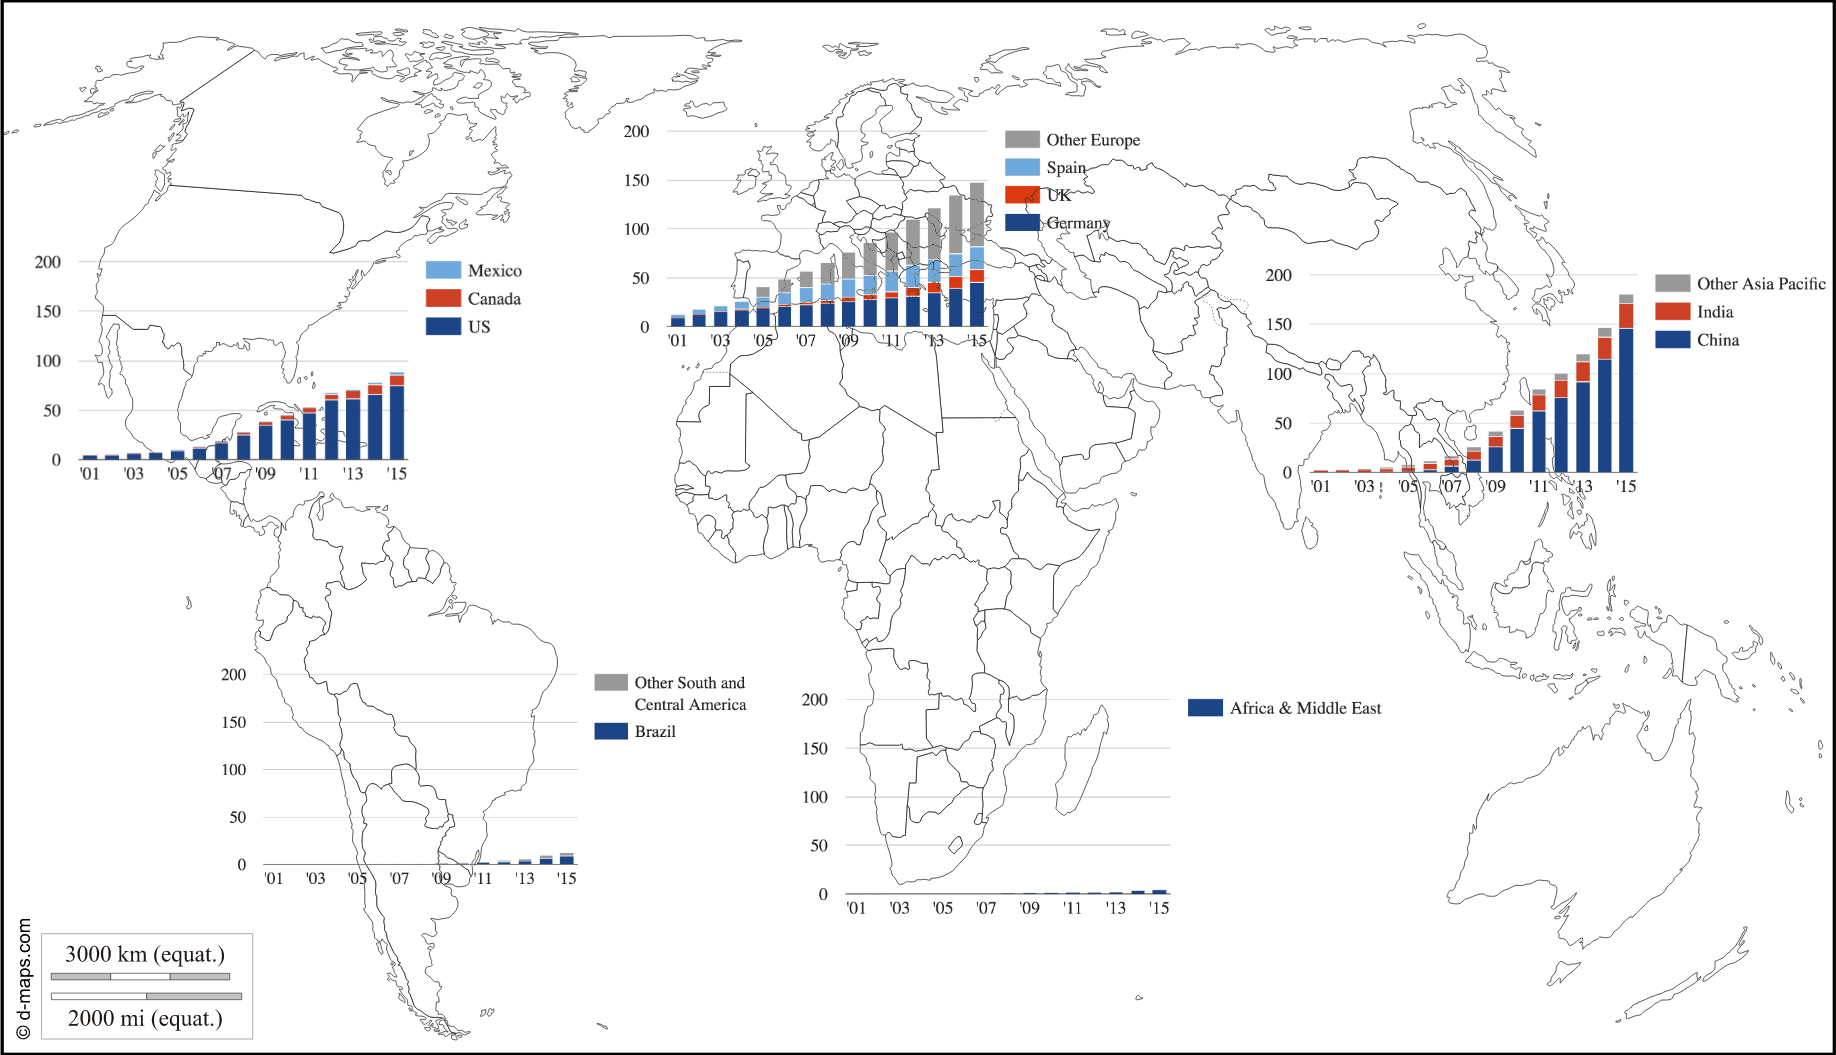
There are a few stand-out features in the map and the underlying data. For instance, China installed more wind capacity in 2015 alone than the UK, Denmark and France combined have ever built.

The 31GW added in China in 2015 was around half the global total of 63GW, which was a record for a single year. China now spends more on renewables than the US and EU combined. It’s worth noting there was a lull in Chinese clean energy investment in the first quarter of 2016, however.
China’s wind capacity of 145GW now exceeds the EU’s and is three times that in Germany. Other notable features of the data are that India has a higher wind capacity, with 25GW, than the UK (14GW) and France (10GW) combined. Poland’s 5.10GW marginally exceeds Denmark’s 5.06GW.
Most of the world’s 433GW of wind capacity is onshore. Europe leads the way on offshore wind, with 11GW, of which 5GW is in the UK. China is the only other significant offshore wind market in the world, with 1GW. However, countries including Japan, South Korea, the US and India are starting to develop the technology.
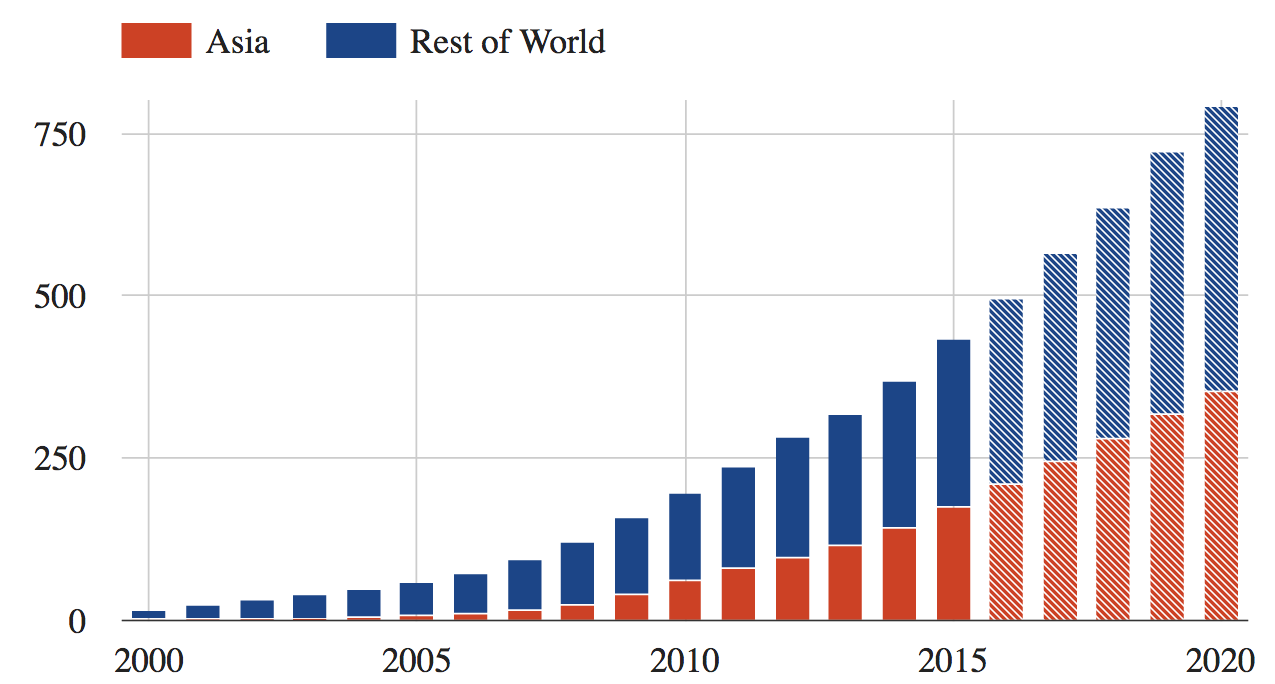
The GWEC report sees strong growth in wind capacity continuing to 2020, with an average annual 13% increase and a total 792GW installed by 2020. This would be an 83% increase from today.
Around half of the increase by 2020 will be in Asia, the GWEC suggests, with wind capacity there doubling to 353GW. This would exceed the global total in 2013.
Carbon Brief analysis suggest the world’s windfarms generated more than 800 terawatt hours (TWh) of electricity in 2015. This is equivalent to the annual output of India’s coal-fired power stations in 2014/15. It is also just over 3% of annual global electricity consumption.
The 63GW of wind capacity added in 2015 will generate around 120TWh each year. This is the equivalent of around 20 mid-sized coal-fired power stations (20GW).