Mapped: How UK foreign aid is spent on climate change
Many of the world’s richest nations have pledged money – known as climate finance – to help vulnerable countries adapt to climate change and to develop their economies without a heavy reliance on fossil fuels.
The UK, one of the world’s wealthiest countries, is among the leading donors. It has promised billions of pounds from its foreign aid budget to help tackle climate change around the world. Almost 8% of UK foreign aid is spent on climate change-related projects.
However, while the total sums of funding are easy to access, it has, to date, been far harder to find out how and where that money is being spent.
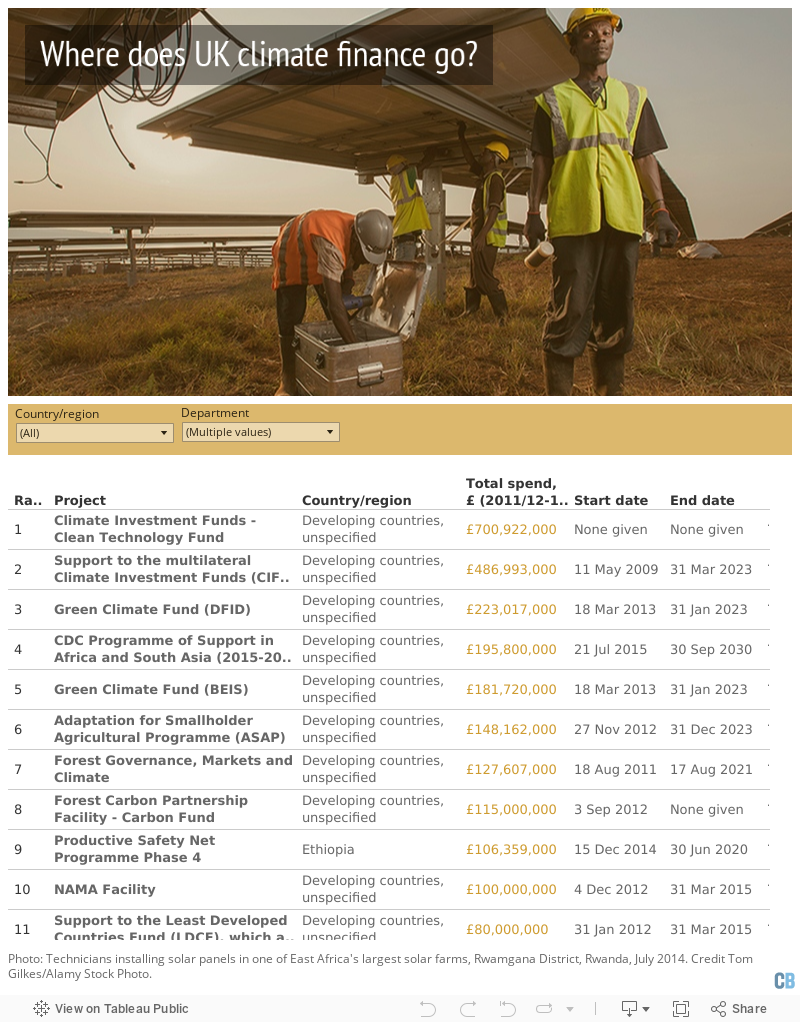
Using freedom-of-information (FOI) requests submitted to the UK government, Carbon Brief can now reveal that the government has committed “climate-specific” aid to 284 projects around the world.
Here, for the first time, Carbon Brief has mapped the countries where a significant proportion of this climate finance is aimed, as well as produce a breakdown of regional spending by continent. Using the newly released information, we have also created a spreadsheet that includes details such as year-to-year funding, location, duration and description of each project.
Our analysis shows…
- Ethiopia has received the most single-country funding since 2011 – £139.7m.
- Africa has received the most regional funding since 2011 – £826.4m.
- Funding rose year-on-year in the run-up to the Paris Agreement in 2015, but has slightly fallen since.
- Since 2011, £4.968bn of UK foreign aid has been spent on 284 climate change projects.
- The UK has given £1.228bn to the multilateral Climate Investment Funds in total since 2011, far more than any single project.
International Climate Fund
In September 2015, David Cameron, the then prime minister, announced the UK was increasing its International Climate Fund (ICF). The ICF is a pool of money from the UK’s foreign aid budget, which aims to help developing countries “address the challenges presented by climate change and benefit from the opportunities”.
Launched in April 2011, the ICF provided £3.87bn up to March 2016, with the funding divided between three departments – Department for International Development (DFID, £2.40bn), Department of Energy and Climate Change (DECC, £1.33bn) and Department for Environment, Food and Rural Affairs (DEFRA, £0.14bn.)
The second tranche of ICF funding, announced on the eve of the Paris Agreement on climate change being adopted in late 2015, committed the UK to an additional spend of £5.80bn from April 2016 to March 2021, with “at least” £1.76bn coming in 2020.
The year 2020 is seen as totemic. This is the internationally agreed deadline for when developed countries should, between them, be “mobilising” at least US$100bn a year (including both public and associated private finance; see KPI section below), to help developing nations address climate change. This financial commitment was one of the key outcomes of the 2009 UN climate talks in Copenhagen.
However, Carbon Brief’s FOI request reveals that the “implementation” period and scope of the ICF extends far beyond the 2011-2021 timeframe that the two official pledging periods, as recognised by the UN climate deal, currently incorporate. Some of the projects provide commitments out to the mid-2030s, whereas others began as early as 2008, but have now ended.
The ICF sits within the UK’s legislated commitment to spend 0.7% of the nation’s gross national income on foreign aid, alternatively known as “official development assistance” (ODA). In 2016, the UK’s ODA was £13.35bn, in line with the 0.7% target.
FOI request
Each year, the UK government publishes a document called “Climate Finance Results”. The latest (pdf) was published in July and covers the year up to March 2017. The document includes the latest results of the ICF’s Key Performance Indicators (KPIs; see below). These are the metrics by which the whole portfolio of ICF investments managed by DFID, the Department for Business, Energy and Industrial Strategy (BEIS, which incorporated DECC in 2016) and DEFRA are judged by the UK government.
It was in the 2016 results document, published by DFID, where the government said that “across the three departments, there are almost 200 projects currently in implementation which are spending climate finance”. In February 2017, Carbon Brief asked DFID for a list of the “almost 200” projects, but only received a partial list.
However, after submitting two FOI requests, DFID released the full list of the projects, including their project codes and a breakdown of annual spending on each project since 2011 up to this year. These codes were then used by Carbon Brief to access all the details of each project on DFID’s Development Tracker website.
The details of a small handful of projects held by BEIS and DEFRA were requested separately. Both departments handed Carbon Brief the details of its projects upon request.
All this information was then used to create a spreadsheet of all the projects, which covers the six-year period 2011/12-2016/17. In total, the ICF spending across this period comes to £4.968bn (specifically, £4,968,116,800).
Additionally, Carbon Brief has produced a more detailed, read-only Google Sheet which contains further information about each project, including descriptions, project codes, year-by-year spending and the percentage of each project’s overall budget that is categorised by the UK government as ICF spending.
You can also use the spreadsheets above to link through to each project’s page on DFID’s Development Tracker website (a small handful of the links go to non-DFID sites), which often includes further documentation about the project’s background, funding and results.
Map
Update: as of 31 March 2025, this map is no longer available.
The map below shows where single-country funding has been spent since 2011. Projects have been added together for each country to produce a total spend. This shows that almost a fifth of the ICF spending over the six-year period – £985.4m – was committed to single-country projects. Ethiopia was the largest recipient with £139.7m – or, on average, £23.2m per year.
As the interactive map shows, ICF spending on single-country projects seems to disproportionately concentrate across the wider eastern Africa region, with countries such as Kenya, Tanzania, Rwanda, Malawi, Uganda, South Sudan, Sudan, Somalia all joining Ethiopia on the recipient list.
Country-specific funding by the UK’s International Climate Fund, 2011/12-2016/17. Chart by Carbon Brief using CartoDBHowever, most money is spent on region-wide projects, or simply on “developing countries” in general, typically via multilateral organisations. Africa is the largest regional recipient of ICF spending, with a total of £826.4m, if the “Africa, regional” and “South of Sahara, regional” totals are combined with all the continent’s single-country projects. Asia received, in total, £369.1m, the Americas received £176.4m and the Middle East received £11.0m over the six-year period.
The “developing countries” category, which largely covers money going to large multilateral organisations, such as the Green Climate Fund, Global Environment Facility and Climate Investment Funds, funded by a wide range of countries, received a total of £3.585bn over the period since 2011. Such organisations typically select projects to fund themselves and disperse funds accordingly, albeit with oversight and steering from donor countries.
The interactive diagram below provides an alternative way to view the breakdown of project spending.
Multilateral, regional and country-specific spending by the UK’s International Climate Fund, 2011/12-2016/17. Chart by Carbon Brief using HighchartsCarbon Brief’s spreadsheet has been checked for accuracy and does not contain examples of double counting, according to both DFID and BEIS, the two departments overseeing the bulk of the funding.
A DFID spokesperson tells Carbon Brief: “Our climate programmes help protect the world’s poorest people from the extreme weather that can cause floods, drought and famine. Tackling global threats such as climate change is squarely in the UK’s national interests.”
DFID says that climate finance is allocated to programmes that build climate resilience and/or support low-carbon growth. It adds: “If climate objectives also form a significant component of a programme with wider development aims, a corresponding percentage of the budget can also be allocated.”
The spreadsheet above includes the percentages for each project. Any project showing less than 100% ICF spending means that the project is also serving development objectives other than tackling climate change. For example, a school-building programme in Africa might calculate a percentage showing how much of the project’s spending was used to install solar panels on the roofs.
EU submissions
Some of the information above is released into the public domain each year. For example, in a submission to the EU earlier last month, as part of its obligations under the Greenhouse gas Monitoring Mechanism Regulation (MMR), the UK government said:
The UK has reported annual spend from its International Climate Fund (ICF) and climate specific ODA eligible spend from the Foreign and Commonwealth Office (FCO) Prosperity Fund [see notes at end of the article]. The UK is providing new levels of climate finance in addition to historic levels of ODA; the provision of climate finance is not resulting in a diversion of wider development spend. The UK has increased its annual climate finance expenditure from £587m in 2009 to £1,049m in 2016. Alongside this increase, the UK’s overall ODA spend increased provisionally from £7.3bn in 2009 to £13.3bn in 2016, in line with growth in GNI (the UK is a 0.7 donor). New climate finance is, therefore, provided in addition to a growing overall aid budget.
The same EU submission contains a partial breakdown of the UK’s climate finance spending. It allows analysis of how much the UK government has dispersed in climate finance in individual years. So, for example, the £1,049m in 2016 quoted above was preceded by £1,254m in 2015, £887m in 2014 and £777m in 2013. Together, this shows an increase in funding in the run-up to the pivotal UN climate talks in late 2015, when the Paris Agreement on climate change was adopted, followed by a small drop in funding the following year.
UK climate finance spending by government department, 2011/12-2016/17. Chart by Carbon Brief using HighchartsThis means that in 2016, for example, 7.85% of the UK’s total foreign aid budget (ODA), which totalled £13,348m (pdf) that year, was spent on climate-related projects.
UK foreign aid spending in 2016. Chart by Carbon Brief using HighchartsThe UK government has also pledged to divide its climate finance equally between spending on adaptation and mitigation. The filings show, for example, that in 2016 this was broadly achieved, with £517m going to mitigation and £533m going to adaption. The remainder, £1m, went to “cross-cutting” projects.
Key performance indicators
Each year, the UK government publishes the latest KPIs (key performance indicators) for the ICF. All projects are asked to report their latest results annually and the government then produces an aggregate.
Below, Carbon Brief has produced a table showing the reported figures from the last three annual KPI results reports, namely, 2017 (pdf), 2016 (pdf) and 2015 (pdf).
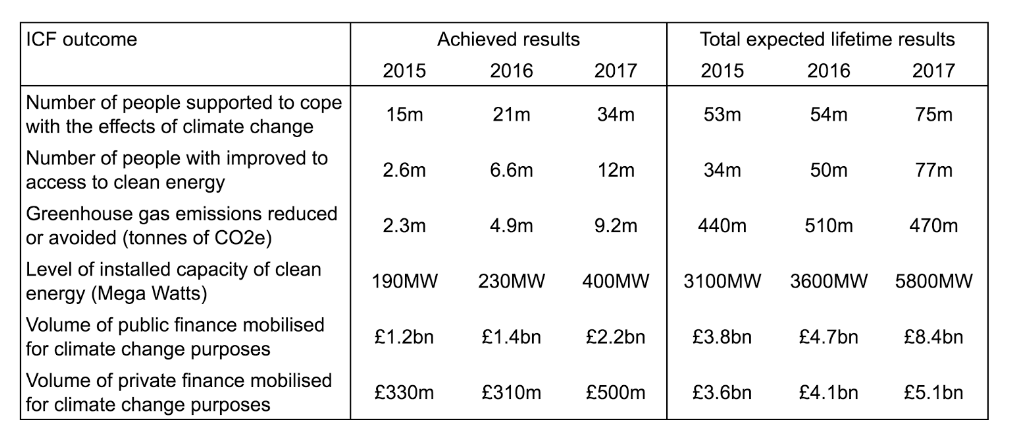
The “achieved results” cover the period 2011/12 up to the year referenced in each column.
The “total expected lifetime results” cover the full period over which programmes are expected to deliver results, as of the year referenced in each column. The reports explain that these “expected lifetime” results “include legacy effects attributable to programmes, i.e. some programmes are expected to continue to realise results 20 years or more after they have concluded”.
The annual results documents contain much more information about the methodologies used to judge each metric. It’s worth clarifying here, though, what is meant by “mobilising” “public” and “private” finance. The 2017 results (pdf) document says the UK government adopts the OECD definitions, adding:
‘Public finance’ transactions are defined as those from official (i.e. government) sources outside of the UK. This could include finance from other donors and partner governments, UN agencies and multilateral or regional development banks and investment agencies…
‘Mobilised’, also referred to as leverage, is ‘the process which occurs when the use of specified resources for a given objective causes more financial resources to be applied for that objective than would otherwise have been the case’. This definition requires that mobilised funds are either additional funds or are existing funds diverted from another (more fossil-fuel intensive) use to this objective…
‘Private finance’ transactions are defined as those from non-public sources such as banks (but not multilateral or regional development banks), private companies, private or company pension funds, NGO money, CDM financing, voluntary carbon credit market, insurance companies, private savings, family money, entrepreneurs’ own capital and sovereign wealth funds. It includes all types such as equity, debt and guarantees. It does not include donor money, aid-agency government money, money from Multilateral Development Banks or Regional Development Banks, or funds from CDC.
It is noticeable that the private finance numbers declared in the EU submissions are much smaller than the sums referenced above in the annual ICF KPI results. For example, the latest EU submission gives the figure of £11m for 2017 “as of July”, whereas it was £21m in 2016 and £39m in 2015. A government official has explained to Carbon Brief that this is because the figures reported to the EU are annual figures and do not include the private finance raised through large multilateral funds, such as the Climate Investment Funds. This is done, in part, to avoid double counting.
Spending on future projects
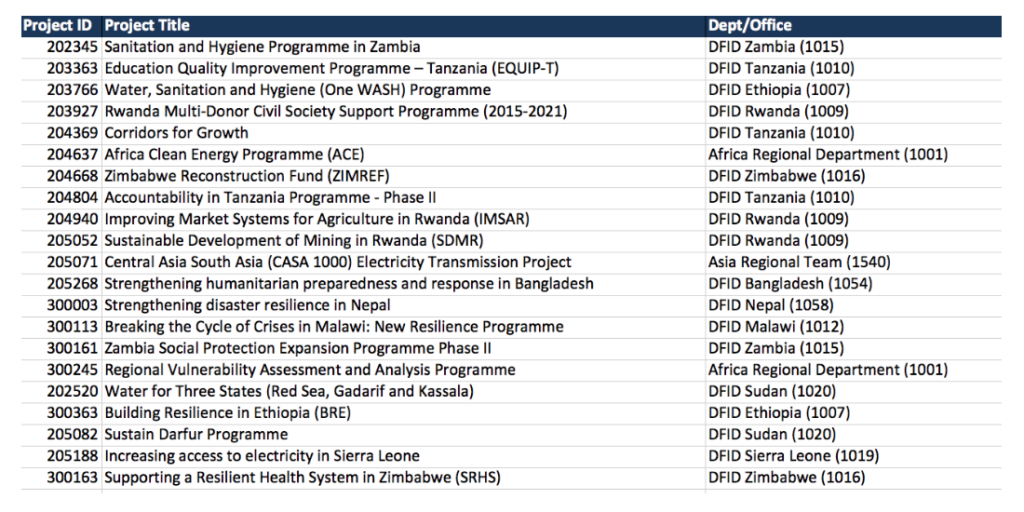
When DFID released the ICF projects information in response to Carbon Brief’s FOI requests it also included a list of “approved programmes” for future ICF spending. The list came with the following note:
The approved programmes listed are additional to those which have already spent ICF, and had not spent any ICF up to the end of 2016/17. Please note that forward looking plans can change which includes those programmes planning to spend ICF in the future.
Below is the list released to Carbon Brief, which predominantly features projects in Africa. It includes each project’s code (which can be used to find more details on DFID’s Dev Tracker website), the name and the local DFID office overseeing the project.
Notes:
The Foreign and Commonwealth Office (FCO) Prosperity Fund mentioned in the EU submission above was recently renamed and broadened to the Cross-Government Prosperity Fund. It is relatively small compared to the ICF commitments overseen by DFID, BEIS and DEFRA. For example, according to the MMR reporting, the FCO Prosperity fund dispersed £28.5m of “climate-specific” spending across the 2013-15 period. The core countries listed as benefitting from this funding were Brazil, China, India, Mexico, South Africa, South Korea and Turkey, where the focus was helping these countries work towards “a low carbon economy and resilient energy markets”. The latest EU submission shows that no climate-specific contribution was made from this fund in 2016.
It’s also important to note that the annual totals in our spreadsheets and map above do not quite add up to the annual totals in the EU submissions. A government official explains that this is because the periods used are not like-for-like. In the EU submissions, Jan-Dec years are used, whereas the data released to Carbon Brief represent April-March years.