Today, Japan restarted a reactor for the first time since it shuttered its nuclear sector in the wake of the 2011 Fukushima disaster.
The Sendai number one reactor could be the first of 25 plants to restart operations, though all are facing legal challenges. If Japan succeeds in resuscitating its nuclear industry, it would once again be a leading producer of atomic energy. If it fails, its climate pledge to the UN will be at risk.
Carbon Brief has mapped the world’s top countries for nuclear power, showing Japan’s dramatic fall and the rise of its Asian neighbours.
Nuclear share
The amount of electricity generated in nuclear power stations grew steadily through the 1980s, 1990s and early 2000s, reaching a peak of around 2,800 terawatt hours (TWh) in 2006 (below left). For comparison, that would have nearly powered the entire EU last year.
With most of the world’s 391 nuclear reactors built in the 1970s and 1980s, however, older plants have started to close down and the expansion of the sector has stalled. Nuclear’s share of global electricity generation has fallen back from a 1996 peak of 18% to just 11% last year (below right).
The average age of the world’s nuclear fleet is 28.8 years, according to the latest World Nuclear Industry Status Report. A third of the reactors in the US are more than 40 years old.
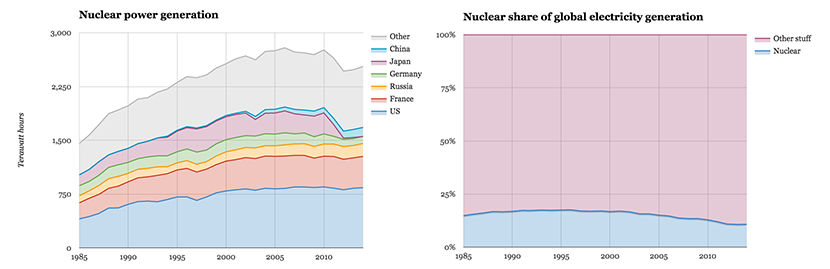
Electricity generation from nuclear power for selected countries and the rest of the world (left). Nuclear’s share of total power generation (right). Source: BP statistical review of world energy. Charts by Carbon Brief.
Apart from ageing reactors, there are three other reasons for the decline of nuclear generation after 2005. First, Lithuania’s nuclear phase out after 2009. Second, Germany’s decision to start phasing out atomic power in stages (green area, above).
The third and most dramatic reason is the Fukushima disaster and Japan’s shuttering of its entire nuclear fleet (pink area). This has only be partly offset by growth in China (light blue area).
The earthquake and tsunami that damaged the Fukushima plant reinforced Germany’s resolve on its nuclear phase out. Other countries reacted in different ways, choosing to improve safety systems but retain their nuclear sectors. Today’s restart at Sendai comes after investing in the world’s toughest safety measures, according to Prime Minister Shinzo Abe.
Nuclear ranking
As recently as 2010, Japan was the world’s third largest generator of nuclear power, as the chart below shows. After Fukushima, it has rapidly lost that spot and today is placed 29th out of 29 countries that have generated nuclear power in recent years (gold line, below).
The chart below shows the world’s top countries for nuclear power, ranked according to electricity output in each year. You can see the rise of Japan’s Asian neighbours South Korea (dark green line) and China (purple line). Iran is a new entrant into the world’s nuclear energy club (dark blue line at the bottom of the chart).
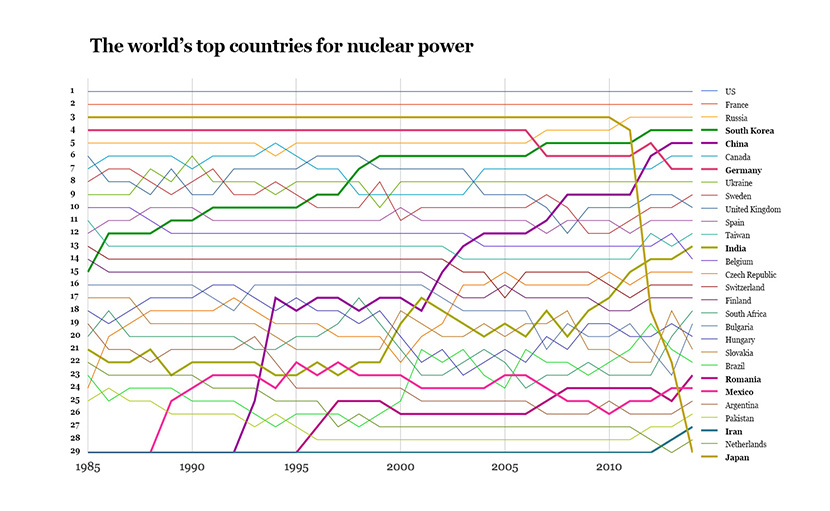
The world’s 29 current atomic energy states, ranked by electricity output in terawatt hours in each year between 1985 and 2014. The US and France have been the world’s top two generators of nuclear power throughout. Source: BP statistical review of world energy. Charts by Carbon Brief.
If Japan meets its pledge to the UN climate process, it could reclaim third spot in the world nuclear rankings. It is aiming to source 20-22% of its electricity from nuclear power by 2030, a low-carbon hole that could be difficult to fill using other sources of power.
Of 54 reactors operating pre-Fukushima, 11 have been permanently closed. Including Sendai, five have approval to restart, while 19 are awaiting a decision on restart plans and 19 have yet to file for permission to reopen.
China is likely to continue rising up the nuclear power rankings, as it is building 24 of the 62 new plants currently under construction, the nuclear industry status report says. China started building two reactors this year, the only ones to break ground so far, though it didn’t start any in 2014.
Russia has eight reactors under construction and India six, ranking second and third in the new nuclear league table. The US has five and South Korea four sites under construction.
Power has started to flow at four Chinese reactors this year, along with one in South Korea. This equals the five reactors that have opened around the world in each of the past two years.
Nuclear maps
Last year, Japan was without nuclear power for the first time since it opened a commercial plant 50 years ago. That means it doesn’t feature the map and chart below, showing the countries that generated the most nuclear-powered electricity in 2014.
You can see that the US is far and away the world’s largest atomic energy producer, generating nearly twice as much as its nearest rival, France. Though China’s output is expanding rapidly, it is still only just ahead of Canada, and even Germany.
The UK, which is hoping to soon build its first new nuclear plant for decades at Hinkley Point in Somerset, ranks 10th — behind Ukraine and Sweden.
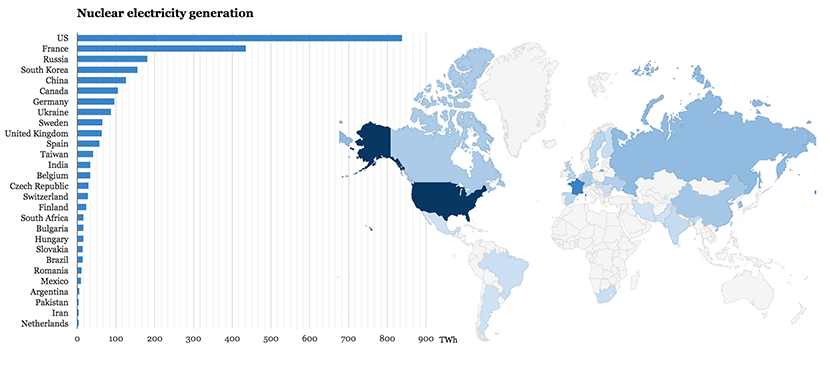
Countries of the world according to their output of nuclear electricity. Source: BP statistical review of world energy. Graphic by Carbon Brief.
A different picture emerges once overall electricity use is taken into account. On this measure it is France that comes out top, sourcing around 78% of its power from nuclear (graphic, below).
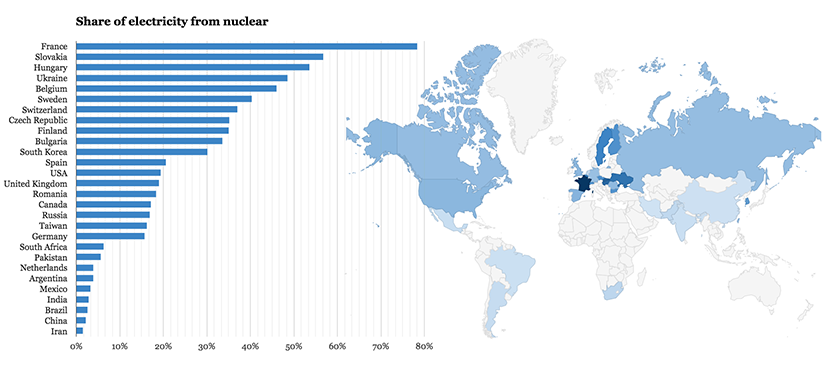
Countries of the world according to the share of their electricity generated from nuclear power. Source: BP statistical review of world energy. Graphic by Carbon Brief.
Conclusion
At the height of its nuclear expansion, France was cutting carbon emissions by 5% a year. This is often cited as the highest rate of decarbonisation ever sustained outside of economic collapse.
Atomic energy remains unpopular however, particularly in some central European countries that witnessed both the buildup of nuclear arms during the cold war and the fallout from the Chernobyl disaster.
Others, like the UK, China or Japan see nuclear power as a vital part of efforts to reduce carbon emissions. While new nuclear plants are continuing to be built, the rate is behind that needed to maintain current levels of output — let alone to raise nuclear’s share of the global electricity mix. If that doesn’t change, the International Energy Agency says the world’s climate goals will be at risk.