Multiple Authors
04.04.2017 | 6:00am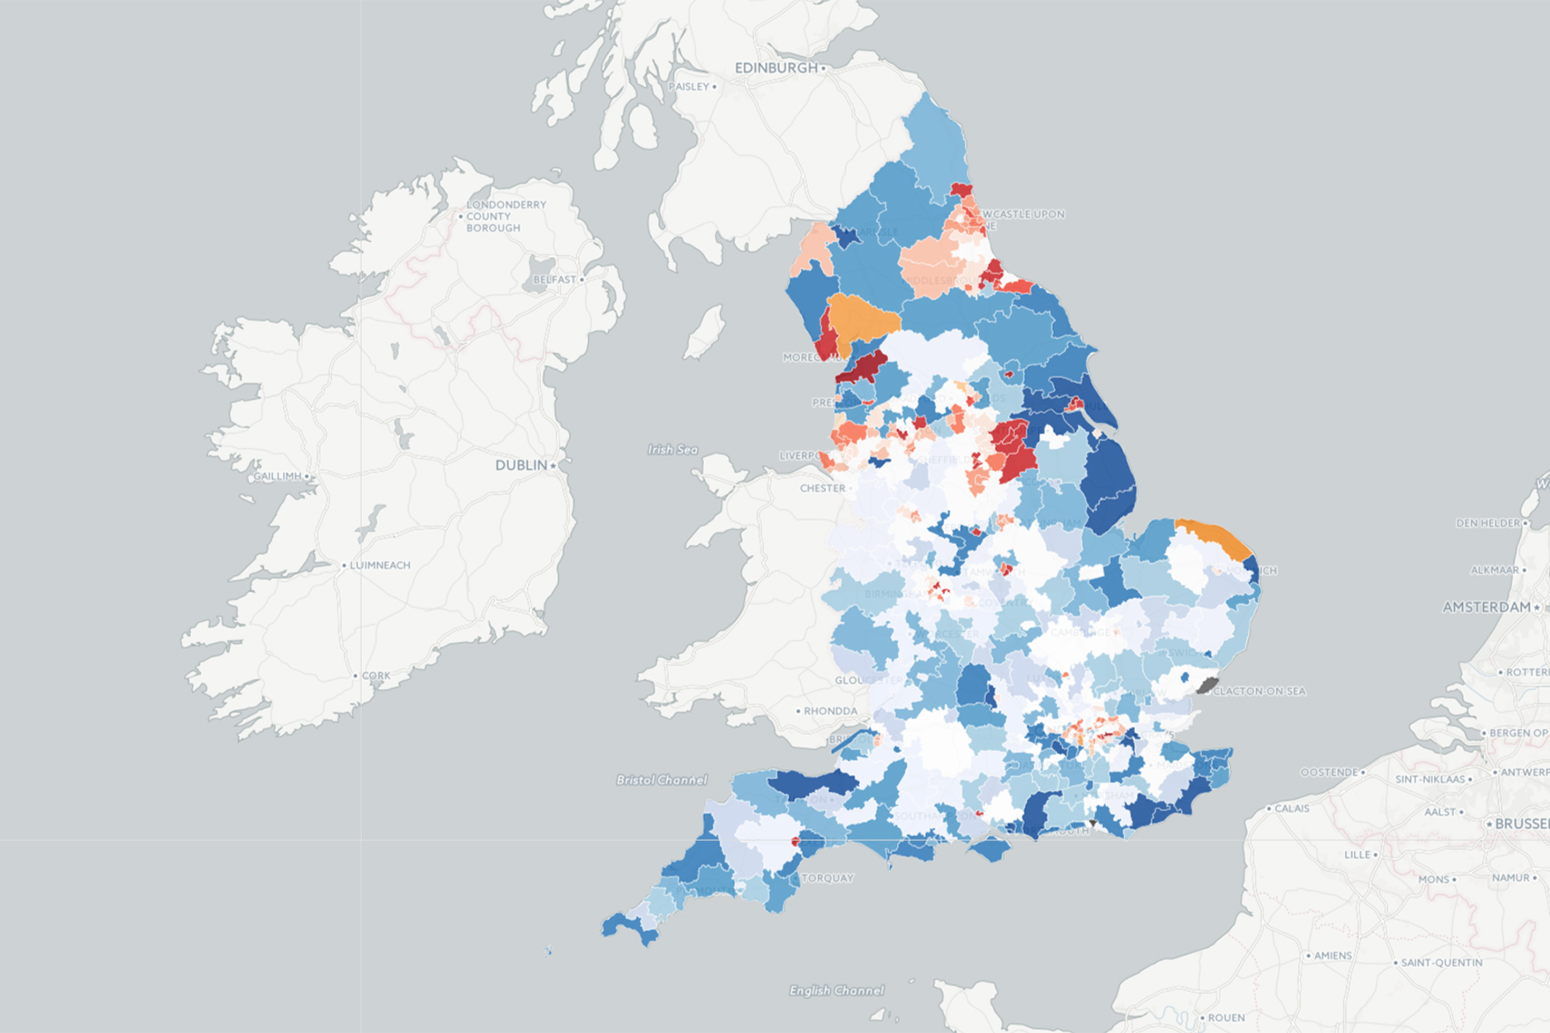
Update: as of 31 March 2025, this map is no longer interactive.
Update: Since this article was published in 2017, the Environment Agency has updated its flood defence spending data, which is available here. The Agency no longer publishes data on the costs of completed schemes. For the 2015-21 investment programme, only estimates for spend in 2019-20 and 2020-21 are now provided.
The UK government recently made a little-noticed update to a dataset which details where billions of pounds of funding is being channelled for flood protection in England.
Carbon Brief has mapped where that funding is being spent across England’s parliamentary constituencies. Our analysis reveals that constituencies in London and the South East account for 60% of the government’s planned funding, yet they account for around 32% of England’s population.
The current Environment Agency programme, which runs from 2015-16 to 2020-21, includes 1,136 flood and coastal erosion projects at a projected total cost of just over £6bn.
The UK government has earmarked approximately £4.4bn towards these English schemes, around £2.5bn of which is being spent between 2015-16 and 2020-21. A further £1.6bn comes from contributions from local councils and drainage boards, private companies and individuals.
You can see where the government’s money is being spent in our interactive map above.
There are three versions of the map, which you can toggle between using the selector in the top left-hand corner. The first version shows the level of total flood defence funding in shades of blue. In the second map, the colour of each constituency represents the political party of its current MP, and the darkness of the shading indicates the amount of funding allocated to it. The third map is like the first, but only for spending up to the end of 2020-21.
Hovering the cursor over each constituency will bring up the the MP who represents it, the amount of funding planned, and how many homes the defences will protect once complete.
Note that flooding programmes for the other parts of the UK are managed by their respective environment agencies and, thus, have different arrangements for sharing data.
Compare constituencies
On first glance, the map suggests that funding is predominantly directed towards coastal constituencies. This is unsurprising, perhaps, considering coastal erosion management projects are also included in the programme. The constituencies with no government funding – shaded white in the map – are mostly found in the Midlands.
It’s worth noting that, in addition to physical flood defences, the programme covers improvements to warning systems, making flooding data and information easily available, and enhancing the response effort when flooding occurs.
You can see the full list of flooding and coastal erosion funding by constituency in the table below.
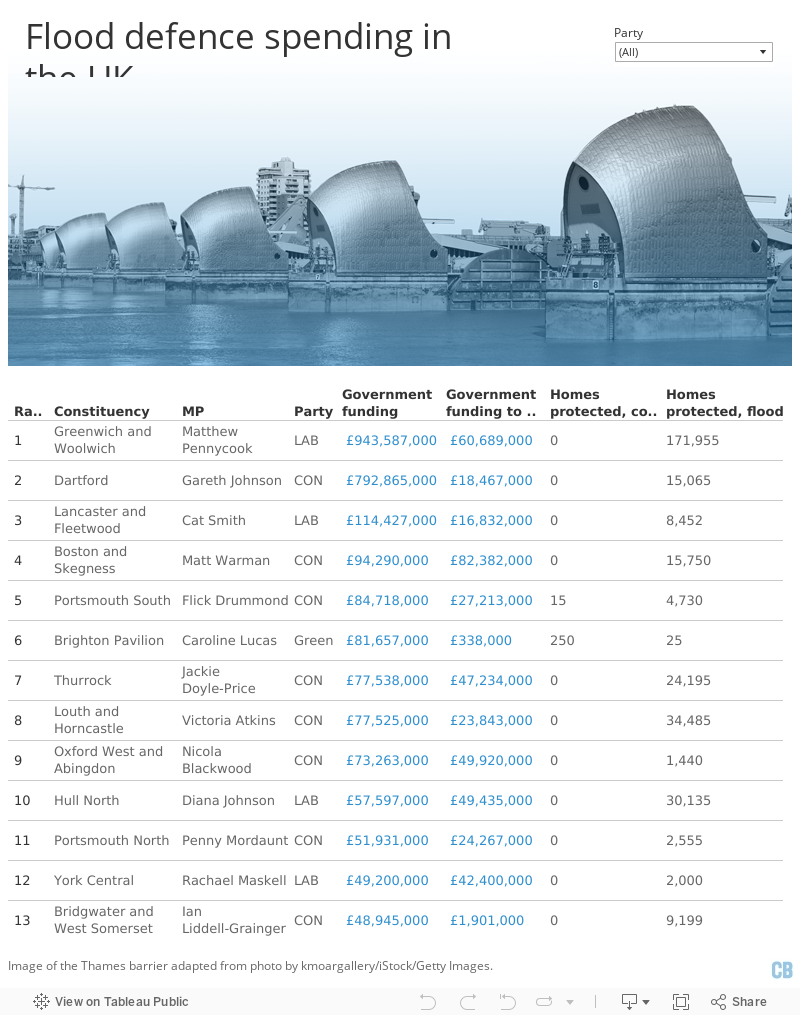
The constituency with the most central government funding allocated to it is Greenwich and Woolwich in London, which is represented by Labour MP Matthew Pennycook. There are 11 projects totalling almost a billion pounds lined up for the constituency over the coming years.
It is, perhaps, no surprise that this constituency finds itself top of the list considering it is home to the Thames Barrier. Opened in 1984, the barrier is a row of 10 huge moveable steel gates spanning the Thames that protects 125 square kilometres of central London from tidal surges.
The vast majority of the money earmarked for Greenwich and Woolwich goes into phase one of the “Thames Estuary Asset Management 2100 programme” (TEAM2100). This is the initial phase of the Thames Estuary 2100 Plan (TE2100), which will manage “tidal flood risk in the Thames estuary to the end of the century and beyond”.
The plan sets out how the Environment Agency will maintain the Thames Barrier and refurbish or replace 350km of floodwalls and embankments, smaller barriers, pumping stations and flood gates. This system of defences protects 1.25 million people and £200bn worth of property, the Environment Agency says.
Second on the list is Dartford, another constituency on the Thames. This constituency, served by Conservative MP Gareth Johnson, has four projects allocated to it totalling just over £800m. As with Greenwich and Woolwich, the bulk of this money is going to the Thames Estuary Phase 1 programme.
Between them, the top two constituencies on the list account for around 40% of all the flood defence and coastal erosion government spending currently outlined for England, and 5% of the money to be spent by 2021. Of course, other constituencies would benefit from the protection afforded by these schemes – particularly, in this case, those all the way along the tidal reach of the Thames.
Another example of wider benefits is the “Brighton Marina to River Adur Flood and Coastal Erosion Risk Management Strategy” (pdf) scheme. This is designated as a project in Brighton Pavilion constituency (which comes sixth on our list), but it will also benefit Brighton Kemptown, Hove, and East Worthing and Shoreham along the South coast.
Making up the rest of the Top 5 are three coastal constituencies: Lancaster and Fleetwood; Boston and Skegness; and Portsmouth South. These are represented by Cat Smith (Lab), Matt Warman (Con) and Flick Drummond (Con), respectively. Central government funding for flooding and erosion projects in these constituencies amounts to £115m, £94m and £85m, respectively.
According to analysis by the Association of British Insurers, which was highlighted in the House of Commons by Mark Warman, Boston and Skegness is the constituency with the most homes at significant flood risk in England or Wales.
The majority of the funding lined up for Boston and Skegness is the £90m for the Boston Barrier, a tidal defence scheme across The Haven, which is estimated to protect more than 14,000 homes once completed. Speaking in Parliament in January, Warman said the barrier “cannot come soon enough”.
You can see how the total government funding for flood defences is divided between political parties in the table below.
| Government funding (£m) | |
| Conservative | 2,603.8 |
| Labour | 1,594.8 |
| Liberal Democrat | 76.3 |
| Green | 81.7 |
| Independent | 14.5 |
| TOTAL | 4,371,0 |
The Environment Agency data also includes figures for how many homes each flood defence or coastal erosion scheme is expected to protect once completed. Not all projects include this data, however, as in some cases these figures aren’t yet known, or the scheme is providing other benefits, such as defending infrastructure or farmland.
The rough estimate using the data available suggests that every home defended costs just under £7,000 in central government funding.

Thames Barrier at dusk with the london docklands in the background. Credit: anthurren/iStock/Getty Images.
Progress
The Environment Agency’s programme divides schemes into three categories according to their progress: construction, development and pipeline.
Schemes designated as “construction” have been given the go-ahead or are already underway. “Development” schemes have their contributions agreed and just need to submit a full business case in order to claim central government funding. “Pipeline” projects are similar to development projects, but haven’t yet secured enough additional contributions to go forward.
The table below shows central government funding divided by the three categories for each region of England. You can see that the majority – 75% – of the funding for projects under construction is going to London and the South East. However, Yorkshire and the Humber currently has the most funding earmarked for pipeline projects.
| Region | No. of projects | Construction (£m) | Development (£m) | Pipeline (£m) | Total (£m) | Total (£/per capita) |
| East Midlands | 108 | 115.8 | 147.9 | 3.3 | 267.0 | 57.1 |
| East of England | 94 | 91.4 | 115.8 | 30.2 | 237.4 | 39.1 |
| London | 89 | 929.1 | 80.1 | 1.3 | 1010.5 | 116.5 |
| North East | 93 | 50.8 | 26.3 | 9.1 | 86.2 | 32.8 |
| North West | 141 | 157.6 | 174.5 | 30.0 | 362.1 | 50.5 |
| South East | 212 | 1195.7 | 397.8 | 20.3 | 1613.8 | 180.4 |
| South West | 276 | 105.1 | 154.2 | 7.1 | 266.4 | 48.7 |
| West Midlands | 97 | 32.1 | 44.6 | 1.4 | 78.0 | 13.6 |
| Yorkshire & the Humber | 175 | 102.2 | 234.5 | 112.9 | 449.6 | 83.4 |
Overall, 60% of the total funding is being directed to London and the South East, yet it makes up around 32% of England’s population. On a per capita basis, that means £180 and £116 per person is allocated for protecting those living in the South East and London, respectively. In contrast, funding for the West Midlands and North East amounts to £14 and £33 per head, respectively.
However, it’s also worth noting that not all schemes will be completed by the end of the current programme in 2020-21, while others will be added to future programmes. The big Thames estuary projects, for example, will continue through the century. So, looking only at spending within the up to 2020-21 gives us the figures in the table below.
| Region | Construction (£m) | Development (£m) | Pipeline (£m) | Total (£m) | Total (£/per capita) |
| East Midlands | 29.3 | 130.4 | 2.5 | 162.1 | 34.7 |
| East of England | 42.1 | 53.5 | 12.4 | 108.1 | 17.8 |
| London | 54.0 | 53.2 | 0.3 | 107.5 | 12.4 |
| North East | 10.4 | 9.5 | 1.6 | 21.5 | 8.2 |
| North West | 29.0 | 113.9 | 4.0 | 147.0 | 20.5 |
| South East | 109.4 | 220.8 | 11.9 | 342.1 | 38.2 |
| South West | 41.8 | 73.0 | 5.0 | 119.9 | 21.9 |
| West Midlands | 13.9 | 41.2 | 0.9 | 56.0 | 9.7 |
| Yorkshire & the Humber | 61.2 | 174.2 | 55.6 | 291.0 | 54.0 |
The chart below shows the per capita figures for total flood defence spending (dark blue) and to 2020-21 only (yellow). You can see that while London and the South East have the most per capita funding from the total of what is currently planned, Yorkshire and the Humber will receive the most per person in the period up to 2020-21.
An investigation by the Press Association (PA) last year revealed that the economic formula used to allocate flood defence spending relies on the value of assets protected. As property in London and the South East tend to have higher prices, this may make “a flood defence scheme that protects those homes look more attractive,” the PA reported at the time.
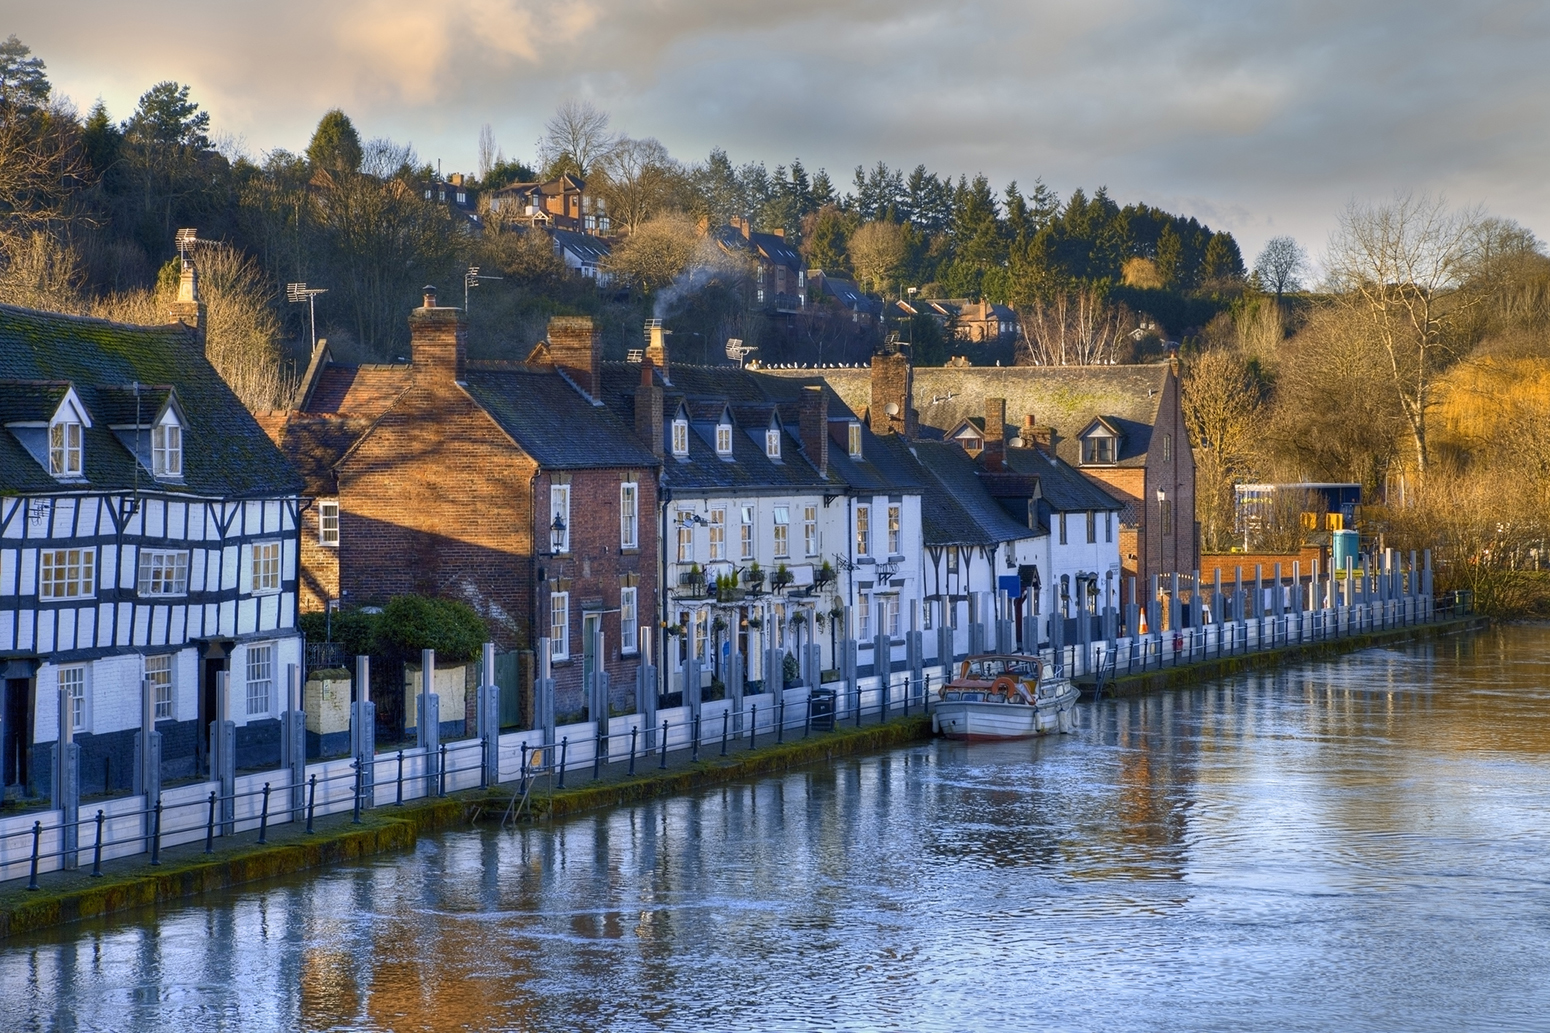
Flood defences on the River Severn, Bewdley, Worcestershire, England. Credit: AndyRoland/iStock/Getty Images.
Additional funding
The current programme of flood and coastal erosion risk management schemes started in 2015. The last update to the Environment Agency’s programme was in August 2015. Since then, the UK was hit by storms Desmond, Eva and Frank. They brought widespread flooding to much of northern England, southern Scotland and Ireland.
As a direct result, the then-Chancellor of the Exchequer, George Osborne, announced an additional £700m of funding for flood risk management in the 2016 Budget. This was funded by an increase in Insurance Premium Tax from 9.5% to 10%.
According to the Budget documents, the extra funding includes £150m for flood defence schemes in Leeds, Cumbria, Calder Valley and York, “which will better protect 7,400 properties”. It also covers up to £25m for flood defences in Carlisle “once the Environment Agency has concluded a review of its needs”.
As a result, the Environment Agency revised its programme to its current form. This was completed in June last year, but wasn’t published until last month.
It should be noted that not all the projects in the 2015 programme are still included in 2017. This could be down to any one of a variety of reasons, the Environment Agency tells Carbon Brief.
Projects may now have been completed, they may have been included under a different scheme, or they may have been declared unviable for financial or technical feasibility reasons. These decisions are made between the Environment Agency and the relevant Regional Flood and Coastal Committee (of which there are 12 across England).
Methodological footnote
The Environment Agency gives the approximate location of every flooding and coastal erosion scheme in their programme, including which parliamentary constituency they’re in. You can find the original data here.
Carbon Brief totalled the funding allocated for projects in each constituency. Where the data identifies a scheme as covering more than one constituency, the funding was allocated equally between them. In a few cases, a scheme covered an entire region (e.g. “Devon-wide”), so the funding was split between all constituencies. We then matched the MPs and their political parties to each constituency.