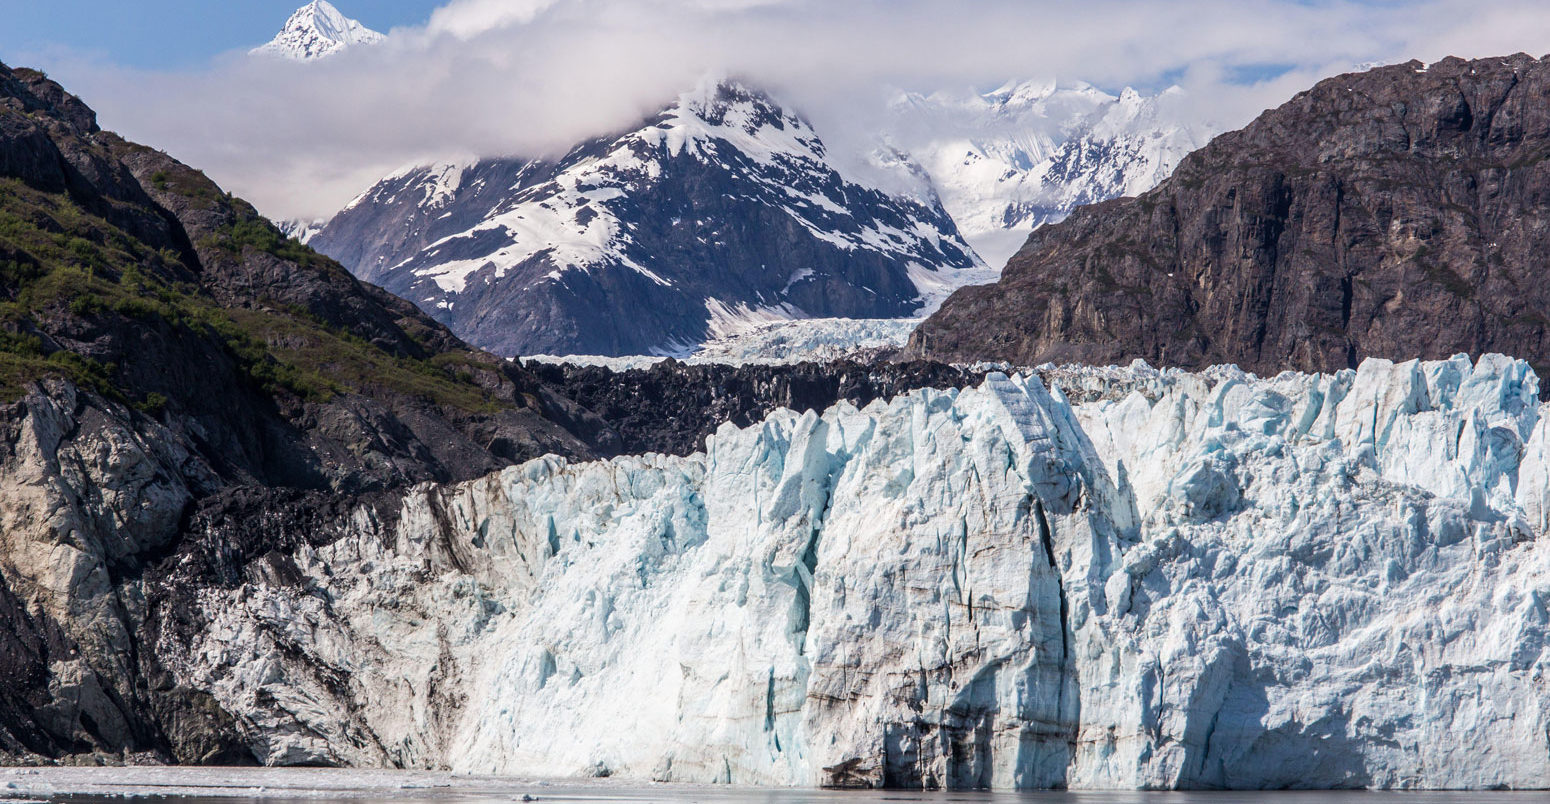
Melting glaciers drove ‘21% of sea level rise’ over past two decades
Ayesha Tandon
04.28.21Ayesha Tandon
28.04.2021 | 4:00pmGlacier melt across the world has accelerated over the past two decades, a new study finds, with the resulting meltwater accounting for 21% of global sea level rise over the same period.
The paper, published in Nature, is the first to analyse the rate of melting from almost every glacier on the planet – around 200,000 in total, excluding the Greenland and Antarctic ice sheets – to show how they have lost mass and thickness between 2000 and 2019.
Glaciers are currently losing more mass than either the Greenland or Antarctic ice sheets, the study finds, and annual rates of glacier thinning have “nearly doubled” from 36cm in 2000 to 69cm in 2019.
The authors highlight that the accelerating rise in sea levels seen over the 21st century – which is “often attributed to the accelerated loss from both the Greenland ice sheet and Antarctic ice sheet” – is also “substantially” driven by melting glaciers.
The data behind this study really are “a game changer”, says one scientist who was not involved in the study. They tell Carbon Brief that the findings are further “rigorous evidence” of the “urgent need for rapid and collective action” to reduce greenhouse gas emissions.
‘A milestone in global glacier monitoring’
Glaciers are slow-moving rivers of ice that form from an accumulation of snow over many years. Around 10% of the world’s land surface is currently covered by glaciers, which store around 70% of the Earth’s freshwater.
However, as global temperatures rise, glaciers around the world – with just a few exceptions – are retreating at an unprecedented rate. Meltwater from glaciers is expected to be the second biggest contributor to global sea level rise during the 21st century.
Although there are more than 200,000 glaciers on the planet, only a few hundred are currently monitored in-situ. This means that scientists need to use other methods to keep track of the world’s retreating glaciers.
Prof Michael Zemp – a glaciologist at the University of Zurich and the director of the World Glacier Monitoring Service, who was not involved in the study – led the last global assessment on glacier mass change in 2019.
He tells Carbon Brief that, in his assessment, his team collected data for around 20% of the planet. By contrast, the new study was able to use imagery from NASA’s Terra satellite to achieve coverage of 97%. This is “a big step forward”, Zemp tells Carbon Brief.
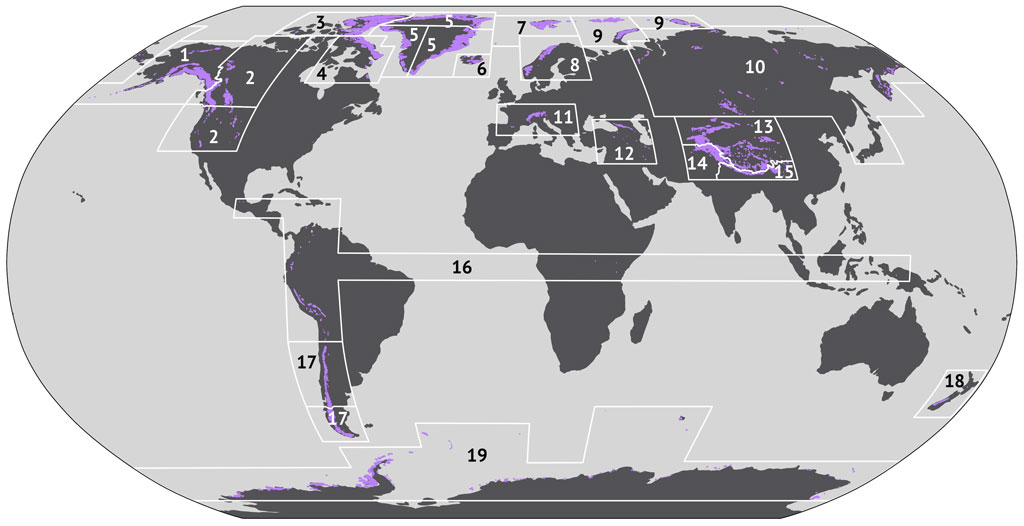
The map below marks the location of the glaciers analysed in this study in purple. In the field of glaciology, 19 “glacierised” regions are often used to help scientists to compare glaciers from different parts of the world. These regions are shown by the boxes and numbers.
On top of the improved spatial coverage, the new study also offers greater detail than the previous assessment. Dr Alex Gardner – a research scientist in the sea level and ice group at NASA, who was not involved in the study – says the study is “truly impressive” and that it “adds detail to an evolving record of glacier demise”. He tells Carbon Brief:
“Through the analysis of over half a million satellite images, the authors were able to construct the most detailed record of how glaciers around the world have – and are – responding to natural variability within the climate and, more importantly, to human caused warming of the atmosphere.”
Dr Robert McNabb – a lecturer at the University of Ulster and author on the study – explains that their study is “the first to report elevation and mass change observations for nearly every glacier in the world at the individual glacier scale”.
“For a glacier modeller like myself, the data behind this study really are a game changer”, says Dr Ben Marzeion from the University of Bremen, who was not involved in the study. He tells Carbon Brief:
“For many years, we have had the huge problem of extremely sparse observations, but with the data from [the new study] we will be able to much better constrain the models we use for projecting glacier change and the glaciers’ contribution to sea level rise. We will also be able to assess the models’ ability to represent climate-glacier interaction a lot better.”
Glaciers vs ice sheets
The authors of the new study calculate that, between 2000 and 2019, glaciers collectively lost around 267bn tonnes of ice every year. Assuming that all the water from melting glaciers eventually reaches the ocean, this means that meltwater from glaciers alone contributed 0.74mm of sea level rise every year.
The mass loss from glaciers has also accelerated over the past two decades, according to the study. The results show that the annual “thinning rate” of glaciers was 36cm on average in 2000, but increased to 69cm by the year 2019. It adds that the “mass loss acceleration” of glaciers has increased by 48bn tonnes per year per decade.
To compare the mass loss from different glaciers, the authors assessed the 19 regions shown in the map. They found that 83% of meltwater comes from just seven of these regions, as shown in the table below:
| Region number, name | Percentage contribution to glacier mass loss | Mass loss (Gt per year) |
|---|---|---|
| 1, Alaska | 25% | 68 Gt/yr |
| 5, Greenland periphery | 13% | 36 Gt/yr |
| 3, Arctic Canada North | 10% | 31 Gt/yr |
| 4, Arctic Canada South | 10% | 27 Gt/yr |
| 19, Antarctic and Subantarctic | 8% | 21 Gt/yr |
| 13-15, High Mountain Asia | 8% | 21 Gt/yr |
| 17, Southern Andes | 8% | 21 Gt/yr |
The table shows that meltwater from Alaska has contributed to one quarter of total glacier mass loss during this century. Zemp explains that this is because Alaska is experiencing rapid warming and the region is also densely populated with glaciers.
The study also compares overall mass loss from glaciers with that from melting ice sheets. The plot below shows mass loss from all glaciers in the study (dark blue), the Greenland ice sheet (mid blue) and the Antarctic ice sheet (light blue).
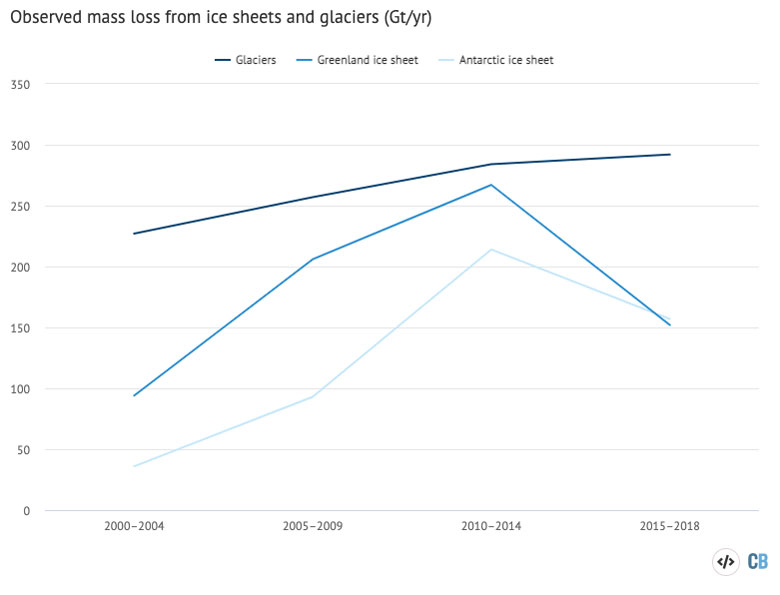
The study finds that, between 2000 and 2019, mass loss from glaciers was 47% higher than from the Greenland ice sheet (GIS) and more than twice that of the Antarctic ice sheet (AIS)
The authors also note that, while glacier mass loss “distinctly accelerated” over the entire 2000-19 period, the mass loss from ice sheets decelerated since a peak in the mid-2010s. From this, the authors “infer that acceleration of sea-level rise since 2000, which is often attributed to the accelerated loss from both the GIS and AIS, also substantially originates from glaciers”.
(Literature suggests that the slowdown in mass loss from the Greenland ice sheet was due to two “anomalous cold summers in western Greenland”, while the deceleration from the Antarctic ice sheet was caused by a cumulative mass gain of 980Gt since 2009 in the Queen Maud Land region of the East Antarctic ice sheet.)
The authors estimate that between 6% and 19% of the 21st century acceleration in sea level rise is due to mass loss from glaciers. Meanwhile, they estimate that 21% of overall sea level rise comes from glacial meltwater.
The study also touches on the difference between “marine-terminating” and “land-terminating” glaciers. McNabb tells Carbon Brief that all glaciers lose mass from surface melting. However, marine-terminating glaciers that run into the sea also lose mass from “melting below the waterline and calving of icebergs.”
Marine-terminating glaciers make up around 40% of Earth’s total glacierised area. However, the study finds that they only contribute 26% to the global mass loss. The authors suggest this is because marine-terminating glaciers show a delayed response to climate change compared to land-terminating glaciers.
Glaciers in a warming climate
To understand the main factors that drive glacier retreat, it is important to understand how they gain and lose mass. Each year, snow falls on the glaciers adding to their “mass balance” during the cold season, and meltwater flows away from the glacier during the warm season. This can be explained using the analogy of a bank balance, Zemp explains:
“A glacier works like a bank account. You have the income, which is the snow – mainly over winter – and then you have the expenditure which is the melt, from temperature, solar radiation and so on. You take the balance at the end of the hydrological year to see if the glacier spent more than it gained.
Using this analogy, Zemp tells Carbon Brief that glaciers are currently in a “financial crisis”, because warming temperatures are causing many regions to lose between 1-3% of their remaining ice volume each year.
The maps below show the change in glacier elevation (top), temperature (middle) and precipitation (bottom) between 2000-09 and 2010-19 in the 19 glacierised regions.
In the top map, reds and yellows show areas where glacier thinning has decelerated between 2000-09 and 2010-19, while blue indicates regions where glacier thinning has accelerated. In the middle map, red shows regions that have warmed, with darker reds showing greater warming, while blue shows regions that have cooled. Similarly in the bottom map, green shows regions that have seen an increase in precipitation, and brown shows a decrease in precipitation.
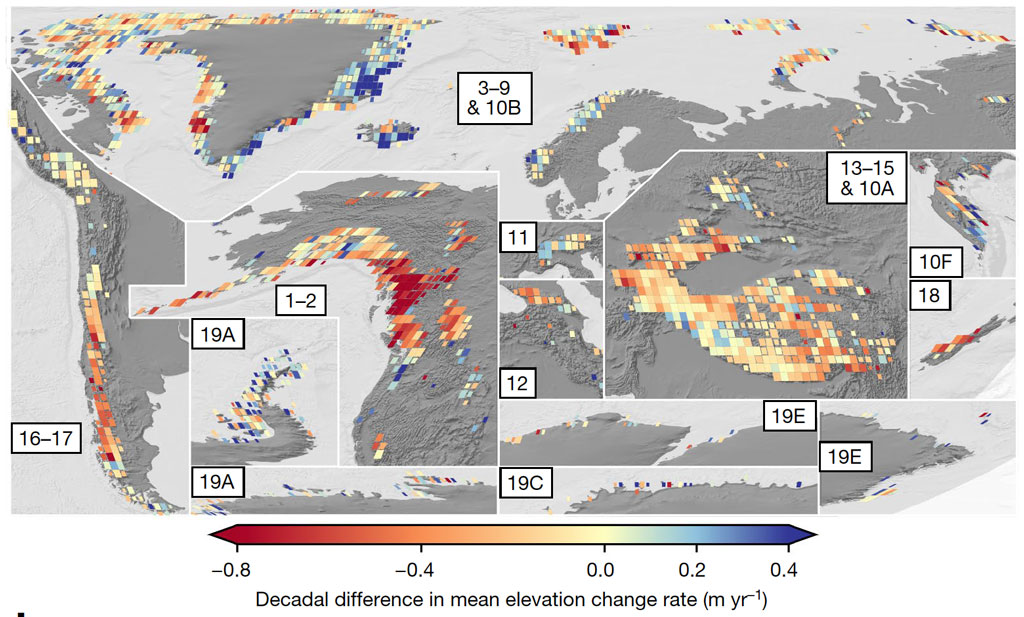
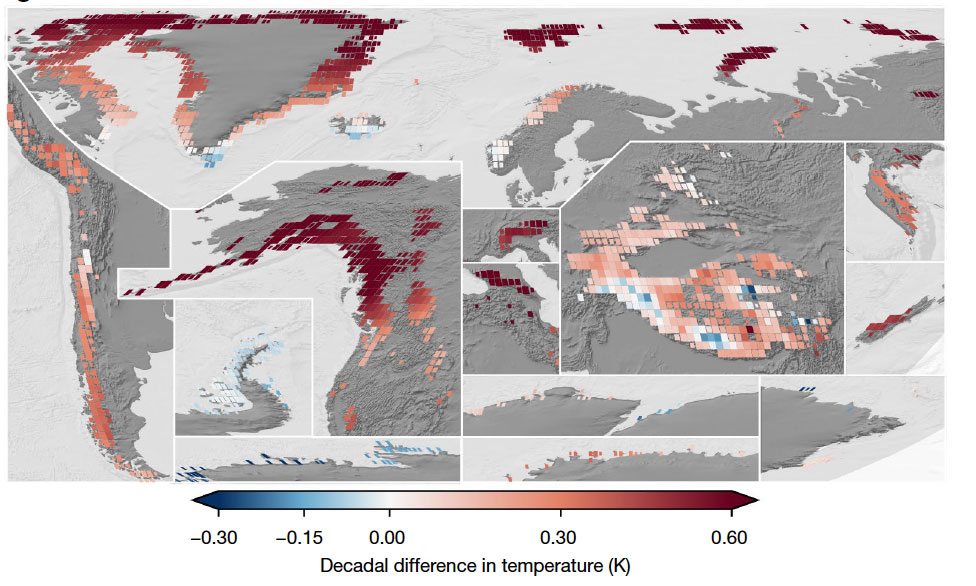
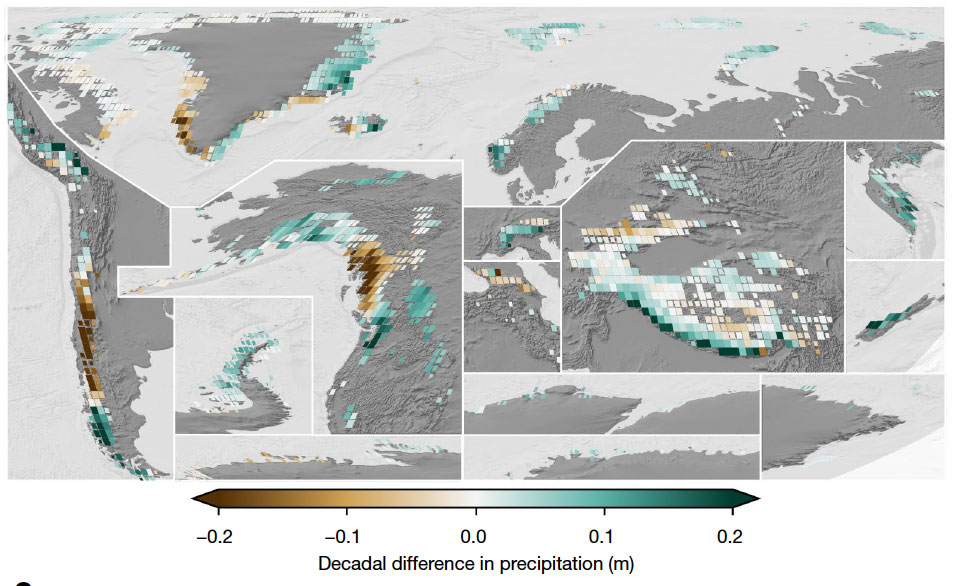
The authors find that many of the changes in glacier mass line up with changes in temperature and precipitation. For example, glaciers in Alaska, western Canada and the US are responsible for 50% of the acceleration in mass loss over the 20th century, according to the study, and the maps show a notable temperature rise and snowfall decrease in these regions.
Similarly, the authors note that there are outliers to the general trend of melting. For example, in Iceland, the glacier thinning rate halved between 2000-05 and 2000-19. McNabb tells Carbon Brief that this was due to a notable increase in snowfall over the area.
The authors find that the impact of temperature on melting glaciers exceeds that of precipitation:
“Although decadal changes in precipitation explain some of the observed regional anomalies, the global acceleration of glacier mass loss mirrors the global warming of the atmosphere.”
Gardner warns that the warming temperatures are putting the world’s glaciers “out of equilibrium” and that the imbalance “will only grow as the full impacts of a warming climate comes into effect”.
He adds that this study should be used as “further scientifically rigorous evidence” of “the urgent need for rapid and collective action to reduce the dumping of greenhouse gases in our planet’s atmosphere”.
Hugonnet et al (2021), Accelerated global glacier mass loss in the early twenty-first century, Nature, doi:10.1038/s41586-021-03436-z
-
Melting glaciers drove ‘21% of sea level rise’ over past two decades
-
Thinning of world’s glaciers ‘nearly doubled’ between 2000 and 2019