New study directly measures greenhouse effect at Earth’s surface
Robert McSweeney
02.25.15Robert McSweeney
25.02.2015 | 6:00pmScientists know that greenhouse gases in the atmosphere cause the Earth to warm. But measuring exactly how much heat they trap is harder than you might think.
Previous studies using satellites have established that more heat is entering the atmosphere than leaving it. But a new study goes a step further and directly measures the amount of warming greenhouse gases are producing at Earth’s surface.
The paper provides the critical link between rising carbon dioxide concentrations and the extra energy trapped in the climate system, the researchers say.
Greenhouse effect
Joseph Fourier first suggested in the 1820s that gases in the Earth’s atmosphere trap heat and help keep the planet warm, coining the term greenhouse effect. Physicist John Tyndall later extended the theory by identifying the gases, such as carbon dioxide and methane, that were responsible for the warming.
Jumping forward a century and a half, we now know a lot more. Using satellites to measure how much of the sun’s energy enters the Earth’s atmosphere, and how much is reflected or re-emitted back into space, scientists have shown that the difference between the two is increasing. This means the Earth is trapping more heat than it used to, and therefore must be warming.
But while those studies show a widening gap between the energy reaching and leaving Earth, they are unable to directly measure how much warming greenhouse gases are causing at a particular point in time. New research, published today in Nature, shows how scientists have directly been able to measure the warming effect of greenhouse gases at Earth’s surface.
Measuring energy
The researchers used a set of instruments to take thousands of measurements at the Earth’s surface. The instruments record the longwave energy that is re-emitted by greenhouse gases back towards the Earth’s surface, which causes the warming.
Making these sorts of measurements on the ground is difficult, says lead author Dr Daniel Feldman, a geological scientist at the Lawrence Berkeley National Laboratory in the US. With weather systems passing overhead, and temperatures and humidity changing frequently, it’s tricky to take energy measurements without other factors getting in the way.
To overcome this problem, the researchers measured temperature and water vapour at the same locations so that their influence on warming could be eliminated from the calculations, leaving just the impact of greenhouse gases.
The scientists used data from 2000 to 2010, collected from two sites in the US: the southern Great Plains and northern Alaska. They chose these sites because of their very different climates, says Feldman. This meant the researchers could investigate both a mid-latitude and a high-latitude location.
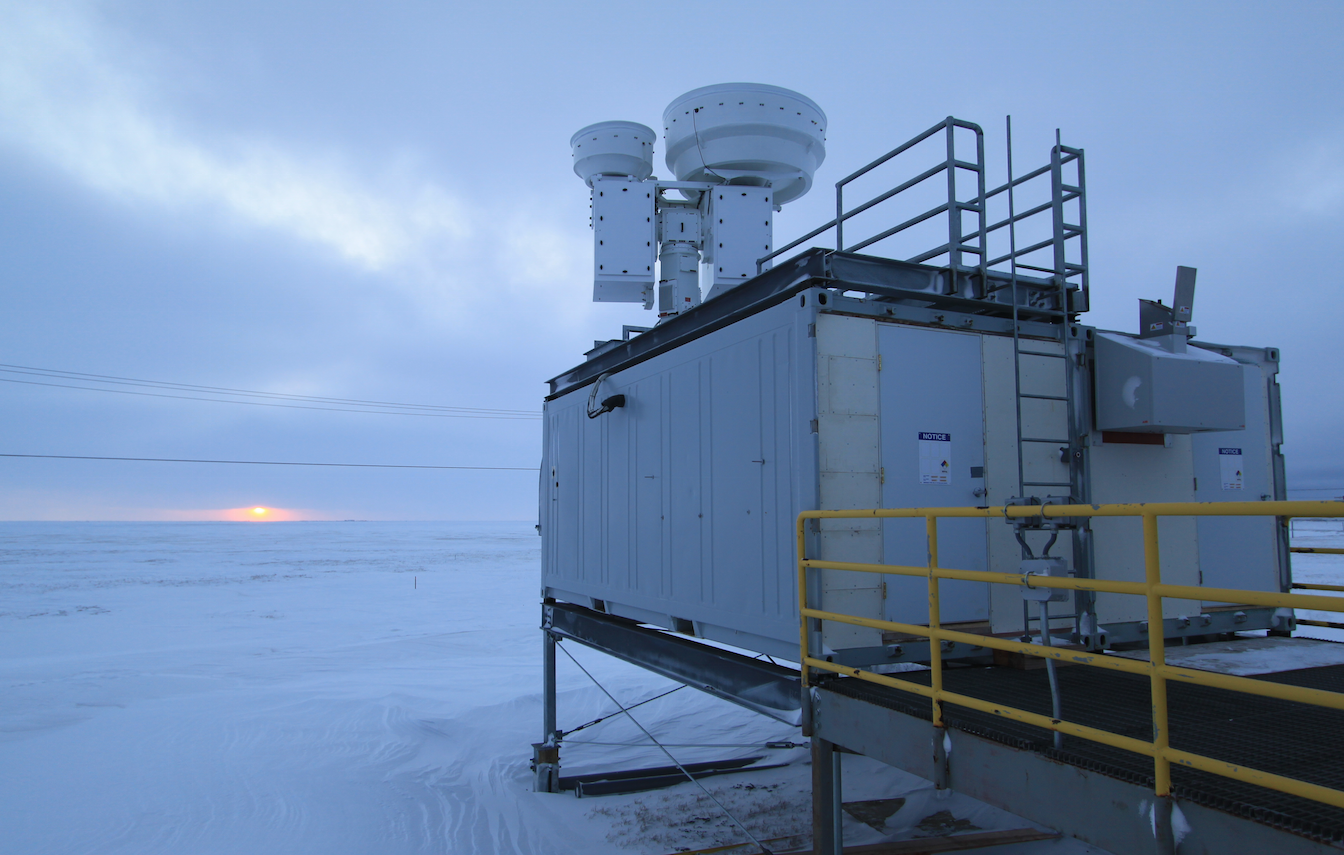
Atmospheric Radiation Measurement Climate Research Facility in Alaska. Credit: Jonathan Gero.
Heating effect
The study finds that rising carbon dioxide concentrations are responsible for emitting around 0.2 Watts per square metre (W/m2) of energy per decade. This is slightly below the global average of 0.27 W/m2 over the last decade estimated by the Intergovernmental Panel on Climate Change (IPCC) in its latest report.
This difference highlights how specific on-the-ground studies can be to their location, Prof Richard Allan, a climate scientist at the University of Reading, tells Carbon Brief:
“The results of the study are not applicable globally, since two relatively dry locations are considered. It is doubtful that a detectable signal would be present at the surface in the wet tropics where there is copious water vapour and cloud.”
Nevertheless, the new study is the first to measure the heating effect of human-caused carbon dioxide at the Earth’s surface, says Allan, and it’s confirmation of what we’d expect from basic physics.
Specific signature
Since greenhouse gases absorb and emit heat at different wavelengths, the researchers could work out the specific ‘signature’ of how much energy each gas emits. They used this method to identify the warming effect of carbon dioxide at the two sites.
Over the 11 years of the study, carbon dioxide in the atmosphere increased by 22 parts per million. The researchers plotted this rise alongside the warming it caused over the same period. You can see this in the video below.
How carbon dioxide concentrations in the atmosphere have changed (blue line) and their warming effect (‘forcing’) on the climate over the same time period (orange line), for the southern Great Plains site (first graph shown) and the northern Alaska site (second). The seasonal fluctuations are caused by the rise and fall in plant photosynthesis in summer and winter, respectively. Source: Feldman et al. ( 2015)
Using the carbon dioxide measurement system, called CarbonTracker, the researchers could track the source of the extra gas in the atmosphere, finding that the majority originated from fossil fuel emissions.
Satellites have previously shown the building greenhouse effect up high in the atmosphere. Now this study, with its feet firmly on the ground, provides direct measurements of the rate at which human-caused carbon emissions are warming the planet here on the Earth’s surface.
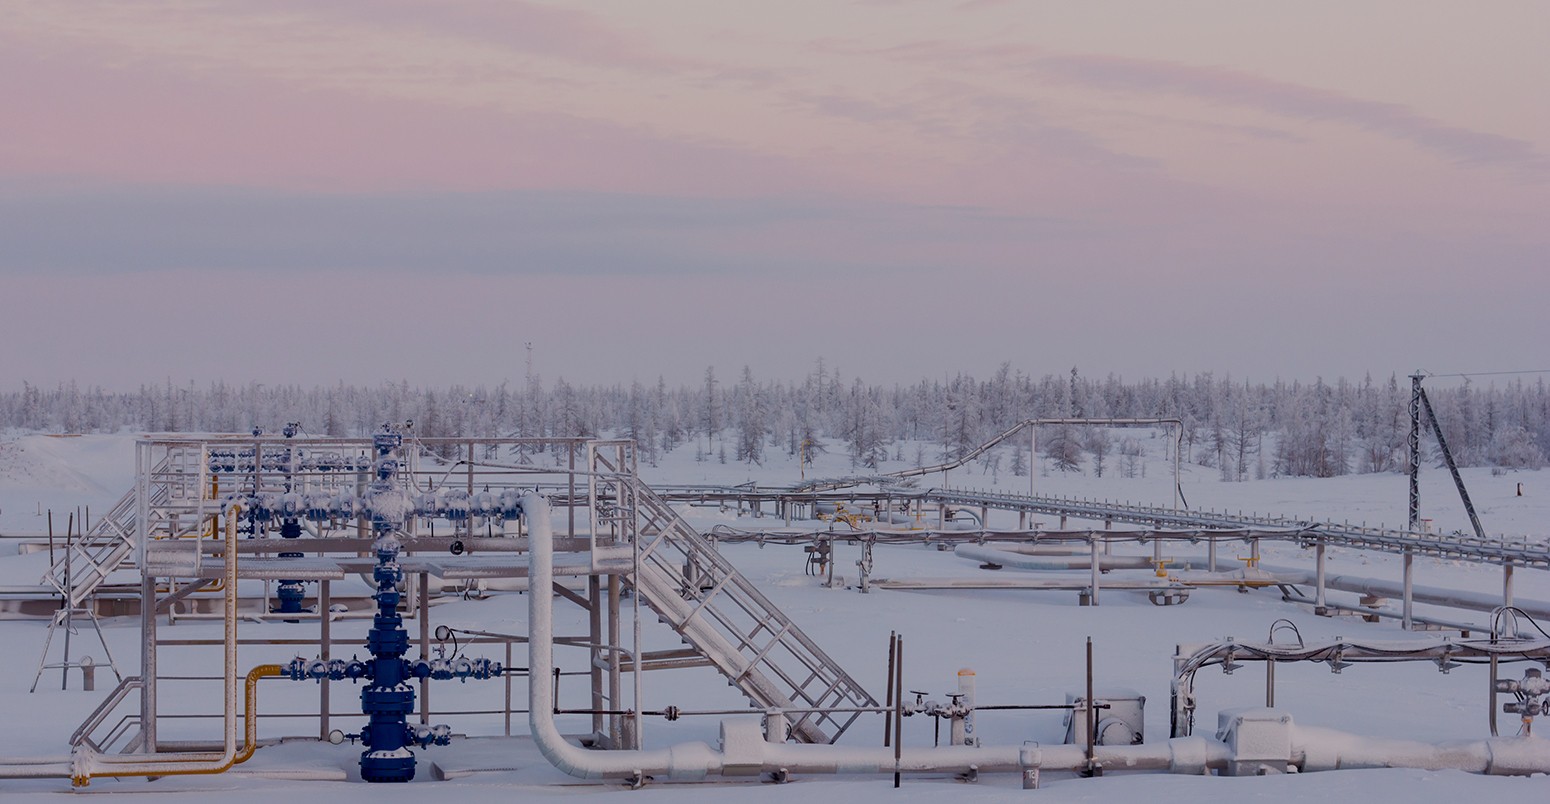
Main image: Gas well above the Arctic Circle.
Feldman, D.R. et al. (2015) Observational determination of surface radiative forcing by CO2 from 2000 to 2010, Nature, doi:10.1038/nature14240