From South America to the Sahel, scientists have for the first time mapped how flood risk rises and falls across the world each time the extreme weather phenomenon known as El Niño hits.
With an El Niño brewing in the Pacific right now, being prepared for flooding can help protect vulnerable communities and curb damages, say the researchers.
Changing rainfall
Every five years or so, a change in the winds in the equatorial Pacific causes a shift to warmer than normal ocean temperatures – known as El Niño, or cooler than normal – known as La Niña.
The warm and cool phases, together known as the El Niño Southern Oscillation (ENSO) affect rainfall patterns worldwide.
While scientists have looked before at the consequences for specific countries, such as Australia,the new study is the first to take a global view, mapping flood risk right across the world.
Flood hazard
The study used detailed hydrological models to compare the amount of flooding in El Niño and La Niña years to the average from all years between 1958 to 2000. The scientists published their findings in the journal Proceedings of the National Academy of Sciences.
The map below shows about 34 per cent of the world’s land area experiences a change in the amount of flooding in El Niño years, compared to 38 per cent in La Niña years. Put another way, more of the world is affected by La Niña than El Niño, at least in terms of altered rainfall.
Parts of Australia see flood risk increase by more than 50 per cent in La Niña years, for example. But not all the changes are negative, the research notes. The red colour in the map below shows regions where flooding decreases in El Niño (top) or La Niña (bottom) years. The darker the red, the lower the risk compared to normal.
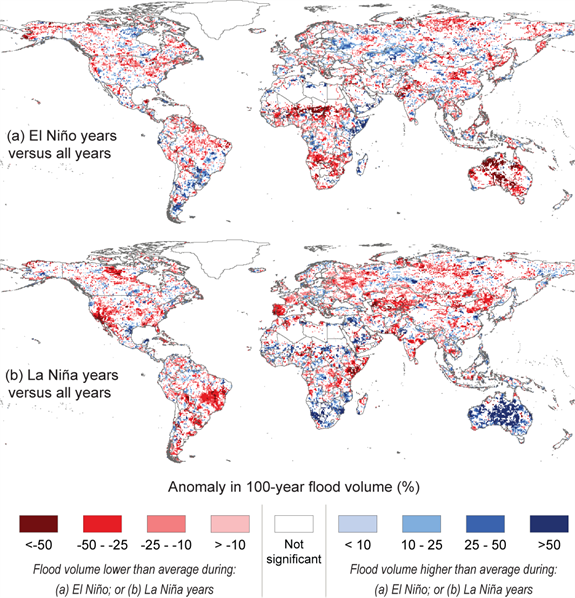
Percentage of land experiencing changes in flood volume with return periods of 100 years, during El Niño years (top) and La Niña years (bottom). Source: Ward et al. (2014)
Averaged over the whole globe, places marked in red pretty much balance out those in blue, for both El Niño and La Niña events. But that masks major impacts on regional scales. And if flooding occurs in crop-growing regions, the food security of a whole population can be jeopardised, for example.
Economic losses
The researchers also looked at how ENSO alters the economic damage caused by flooding.
The study finds that almost half the earth’s surface – or 44 per cent – sees big changes in economic damages from flooding in either El Niño or La Niña years.
The worst-affected regions are parts of southern Africa, the Sahel, western Africa, Australia, western United States and parts of South America, as the map below shows.
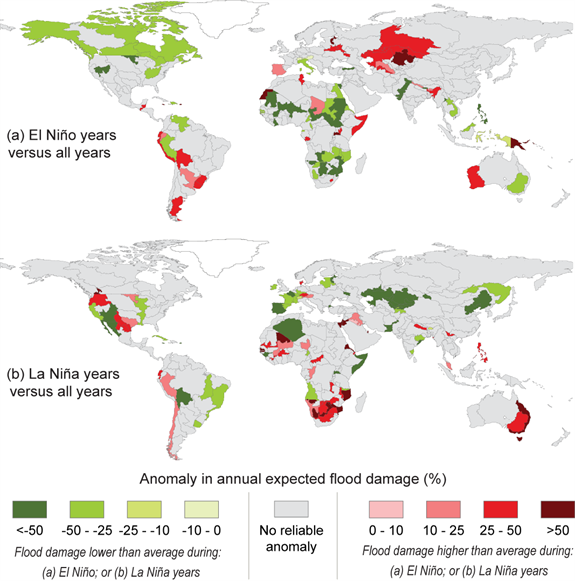
Percentage of land experiencing changes in economic damages during El Niño years top) and La Niña years (bottom). Source: Ward et al. (2014)
In El Niño years, 10 per cent of the globe sees higher than normal damages, while 19 per cent sees lower than normal. In La Niña years, the figures are not dissimilar. Damages are higher than usual over 10 per cent of land area, and lower than usual over 13 per cent.
But most places are affected by either El Niño or its cooler counterpart, not both. Only seven per cent of the world’s area sees strong, opposite effects during both phases, as the blue wedge in the left hand pie chart below shows.
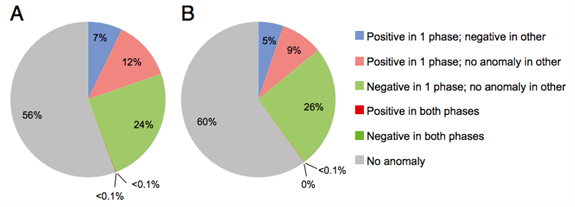
Percentage of global area experiencing changes in flood damage (left) and area in which those changes are greater than 25% (right). Source: Ward et al. (2014)
The flood risk in vulnerable places is likely to intensify as the climate warms, the paper notes. As temperatures rise, scientists predict rain is likely to fall in heavier bursts.
Other research suggests the strongest El Niño events may become more frequent with climate change. The paper explains:
“If so, given the relationship between ENSO and flood hazard reported here we would anticipate increases in flood risk variability across many, or indeed almost half, of the world’s terrestrial regions in the future.”
Advance warning
This study is useful because until now little has been known about how ENSO affects flood risk differently in different regions of the world.
This maps also highlight how there can be large variations within some countries, such as Australia or the United States.
The latest forecast from scientists is that we should expect El Niño to make an appearance within the next one or two months, and last through until northern hemisphere Spring.
In a year like this, with an El Niño brewing in the Pacific, the new information from this study may help regions better prepare for disasters, lead author Dr Philip Ward from VU University in Amsterdam tells us.
Together with scientists’ ability to predict several months in advance when an El Niño or La Niña will hit, vulnerable regions will be better placed to limit the worst impacts, Ward explains:
“For example, in regions where ENSO strongly influence flood risk, humanitarian and aid agencies could temporarily increase or relocate food and medicine stocks ahead of flood events, hereby improving supply availability when floods do occur”.
But there are both positive and negative impacts of El Niño and La Niña, the paper notes. And it’s vital to consider both to properly assess the level of risk now, and how it’s likely to be altered with climate change, the researchers say.
Source: Ward, P.J. et al. (2014) Strong influence of El Niño Southern Oscillation on flood risk around the world. Proceedings of the National Academy of Science. doi: 10.1073/pnas.1409822111