
Ocean data upgrade confirms pace of recent warming
Robert McSweeney
01.04.17Robert McSweeney
04.01.2017 | 7:00pmEvery day, thousands of measurements of the Earth’s temperature are taken across the world by weather stations, ships, satellites, floating buoys and weather balloons.
Scientists combine these different data sources to provide a complete picture of global surface temperature. This is no mean feat. There are four main global datasets and they each go about it in slightly different ways.
A new study, published in Science Advances, uses the latest sea surface temperature (SST) data to see which global dataset best captures the warming in recent decades. The closest match, the authors find, is the one that shows the fastest temperature rise.
Technological advances
Since the instrumental temperature record began in the mid-19th century, technological advances have gradually made collecting global temperature data more sophisticated.
Stitching together data from different instruments adds a complicating factor for scientists attempting to construct long-term global temperature records, says the new study’s lead author Zeke Hausfather, a climate scientist and energy systems analyst at Berkeley Earth. He tells Carbon Brief:
“The challenge with this is that it creates uncertainties and judgement calls about how best to account for – and correct – changes in instruments.”
For example, when ships first started recording SSTs, crews would lower a bucket over the side and measure the temperature of the water they pulled up. But since the 1940s, most ships automate collecting temperature data from the water they take in to cool their engines – known as “engine room intakes (ERI)”
As the engine rooms of ships tend to be rather warm, ERI measurements of SST are often slightly higher than the actual temperature of the water. This is well understood, and scientists take it into account when they are construct the global records.
In recent decades, technology has moved on again. As you can see in the chart below, the number of measurements taken by ships (dark blue shading) has declined while those from buoys floating on the ocean surface (yellow and blue) have increased dramatically.

Chart shows number of sea surface temperature observations over time by instrument type in NOAA’s ICOADS database. The number of observations from moored (blue shading) and drifting (yellow) buoys has increased dramatically in recent years, while the number of measurements from ships (dark blue) has decreased. Source: Hausfather et al. (2017)
Comparison
The new study compares how well the world’s major global datasets are keeping up with these changes to SST measurements and the impact it has on how much warming they show over recent decades.
The study considers three of the four principal global datasets for SSTs – from the National Oceanic and Atmospheric Administration’s (NOAA) in the US, the Met Office Hadley Centre in the UK and the Japan Meteorological Agency (JMA). These agencies combine all available types of data to create their records – but using slightly different approaches.
The NOAA dataset was of particular interest to Hausfather and his colleagues because it was recently updated to account for the rapid increase in SST measurements from buoys. It also added more weight to the data collected from buoys because they’re generally considered more accurate and reliable than measurements from ships.
To make the comparison, the researchers created three separate “homogenous” records, each based on just one type of SST measurement – floating buoys, satellites and Argo floats.
Because each record only uses one instrument type, they don’t require any adjustments to account for changes in technology or approach, explains Hausfather. Argo floats are a bit more sophisticated than the buoys, he adds:
“Buoys stay on the surface, float around, and send measurements of the top meter of water up to satellites. Argo floats dive deep down in the oceans (2000 meters or more), and take temperatures as the rise back up. They take near-surface temperatures at about five meters in depth.”
Their results show that all three homogenous records agree well with the new NOAA dataset for SSTs in recent decades. You can see this in the chart below, which shows the global SSTs since 1998 for the new NOAA dataset (red line), the old NOAA dataset (blue), the buoys (green) and from satellites (orange).
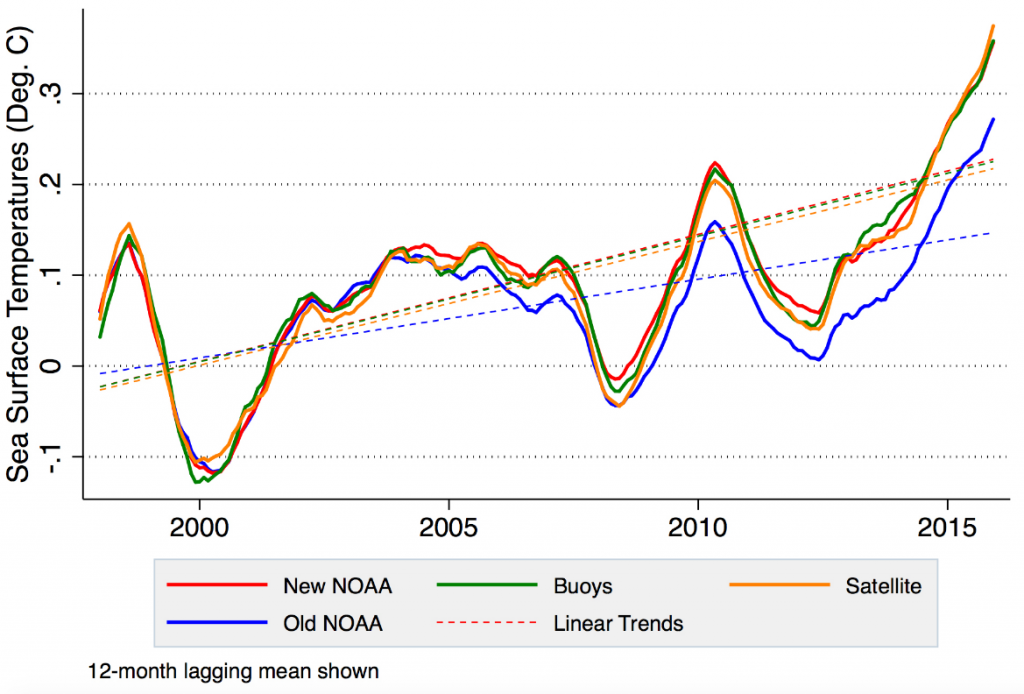
Comparison of SST data from version 3 (blue line) and version 4 (red) of NOAA’s ERSST dataset with homogenous data from buoys (green) and satellites (orange). Data covers 1998 to 2015. Credit: Zeke Hausfather
On the other hand, the study finds the Met Office Hadley Centre and JMA temperature records slightly underestimate the amount of warming in the three homogenous records. You can see the results for the Hadley Centre by the purple line in the chart below.
The slightly slower rate of warming occurs because, although the Hadley Centre dataset accounts for the difference between ship and buoy data, it doesn’t add any weighting in favour of either data source, the researchers say.
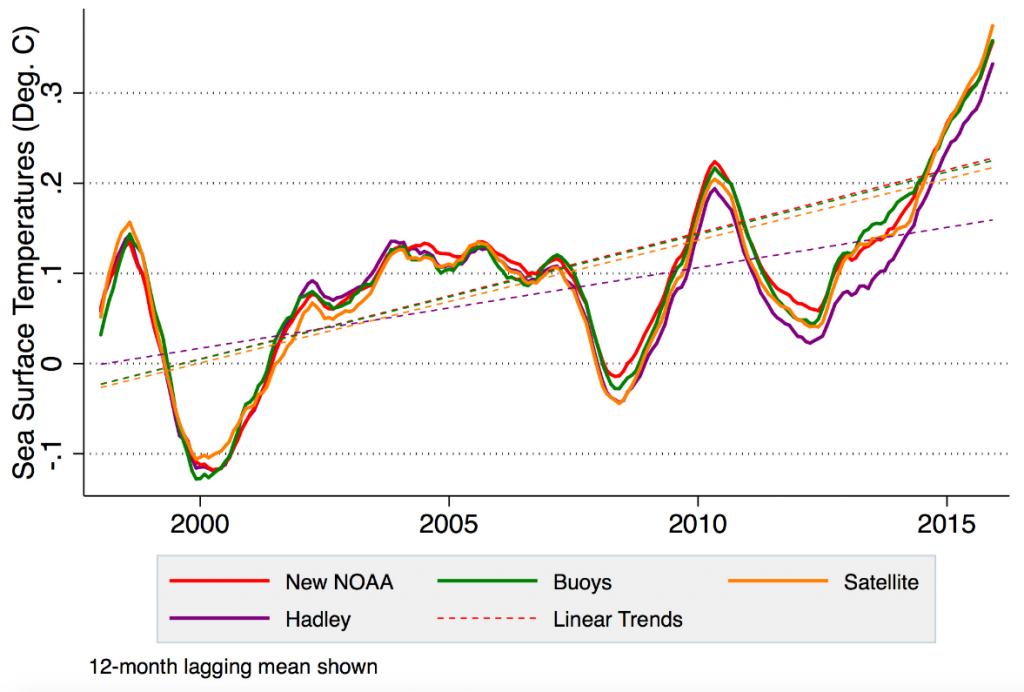
Comparison of SST data from the Hadley Centre HadSST3 dataset (purple line) and version 4 (red) of NOAA’s ERSST dataset with homogenous data from buoys (green) and satellites (orange). Data covers 1998 to 2015. Credit: Zeke Hausfather
Global surface
In the NOAA dataset, the rate of increase in global SSTs between 1997 and 2015 is 0.12C per decade. This is faster than the 0.07C increase in the previous version of the dataset, before the updates to sea surface temperature.
As oceans cover 71% of the Earth’s surface, this higher rate of SST increase has a knock-on impact on the observed rate of warming for the global surface temperature record as a whole.
The new NOAA SST data roughly doubles the rate of global surface temperature rise between 1998 and 2012, says Hausfather, and increases it by about a third from 1998 to present. He explains:
“In the grand scheme of warming – e.g. the last 50 years – the adjustments are relatively minor, but they have a big impact in recent years.”
The study’s findings also suggest that the gap between the NOAA dataset and the other global records might continue in future, Hausfather says:
“If Hadley and JMA don’t update their datasets, I suspect we will see a noticeable divergence going forward.”
However, the JMA does have an updated SST dataset in the works, adds Hausfather, and suggests the Hadley Centre may be in the process of updating their own record too.
Replicating results
The new study reinforces the findings of a paper published in Science last year. The study by lead author Dr Thomas Karl, the now-retired director of NOAA’s National Climatic Data Center, used NOAA’s new dataset to assess the global trend in surface temperature since 1998.
Their findings suggested that the much-discussed “slowdown” in warming at Earth’s surface was largely a result of the way temperature records have been pieced together. (You can read more from Carbon Brief’s coverage of the story at the time.)
In effect, the new paper supports this conclusion, says Hausfather:
“We feel that by replicating NOAA’s results using independent datasets we’ve significantly bolstered their original claim, and helped explain the divergence between their series and the commonly used Hadley data in recent years.”
Hausfather explains further in the video clip below.
Taking a broader view than any specific time period, the study helps to differentiate between changes in climate and changes that arise from improvements in instrumentation, says Prof Tim Osborn, professor of climate science at the University of East Anglia, who wasn’t involved in the study. He tells Carbon Brief:
“Their approach…is a sensible way to evaluate of the reliability of SST trends in recent decades during which there has been a dramatic shift in our climate observing systems (notably from ships to buoys).”
Hausfather, Z. et al. (2017) Assessing recent warming using instrumentally homogeneous sea surface temperature records, Science Advances, doi:2017;3: e1601207