Roz Pidcock
28.04.2015 | 1:45pmThe Global Warming Policy Foundation (GWPF), Lord Lawson’s UK-based climate skeptic lobby group, has announced it is launching an inquiry into the integrity of global surface temperature records.
Of particular interest, the group says, is whether “adjustments” to the raw data to account for gaps and inconsistencies have increased the warming trend over the industrial period.
Carbon Brief has spoken to Prof Richard Muller, physicist and self-professed skeptical scientist, who carried out a very similar inquiry a few years ago as part of the Berkeley Earth surface temperature ( BEST) project, based in California. Muller tells Carbon Brief:
“From a scientific point of view, it would be irresponsible not to adjust â?¦ it would be considered poor science to avoid such corrections â?¦ [and] they do not affect the substantial results.”
The BEST project
In 2011, Prof Richard Muller and daughter Liz, co-founders of Berkeley Earth, embarked on a project. They, too, questioned the reliability of global surface temperature records. Muller says:
“We have been watching the [GWPF] Data Review Project with interest. The project is looking hard at exactly the sorts of issues that got us into this arena five years ago. It is good that we are included in the organisations that they are looking at, because we feel we have not only addressed most of the issues, but have done so transparently, and discuss them openly in our published papers.”
After reanalysing all the existing surface temperature data, with and without adjustments, the BEST team concluded that the world has warmed 1.5C over the past 250 years.
The GWPF inquiry will look at three major datasets to study global temperature, compiled by the UK Met Office, the US National Oceanic and Atmospheric Administration ( NOAA) and NASA , as well as the BEST reanalysis.
The GWPF says the review won’t look at satellite records of lower troposphere temperature, which show a warming trend over the last 35 years consistent with the surface data. The reasons aren’t given, other than that satellites are “beyond the scope of this inquiry”.
You can read much more about global surface temperature and satellite records in Carbon Brief’s explainers, and see how their trends compare in our graphic, below.
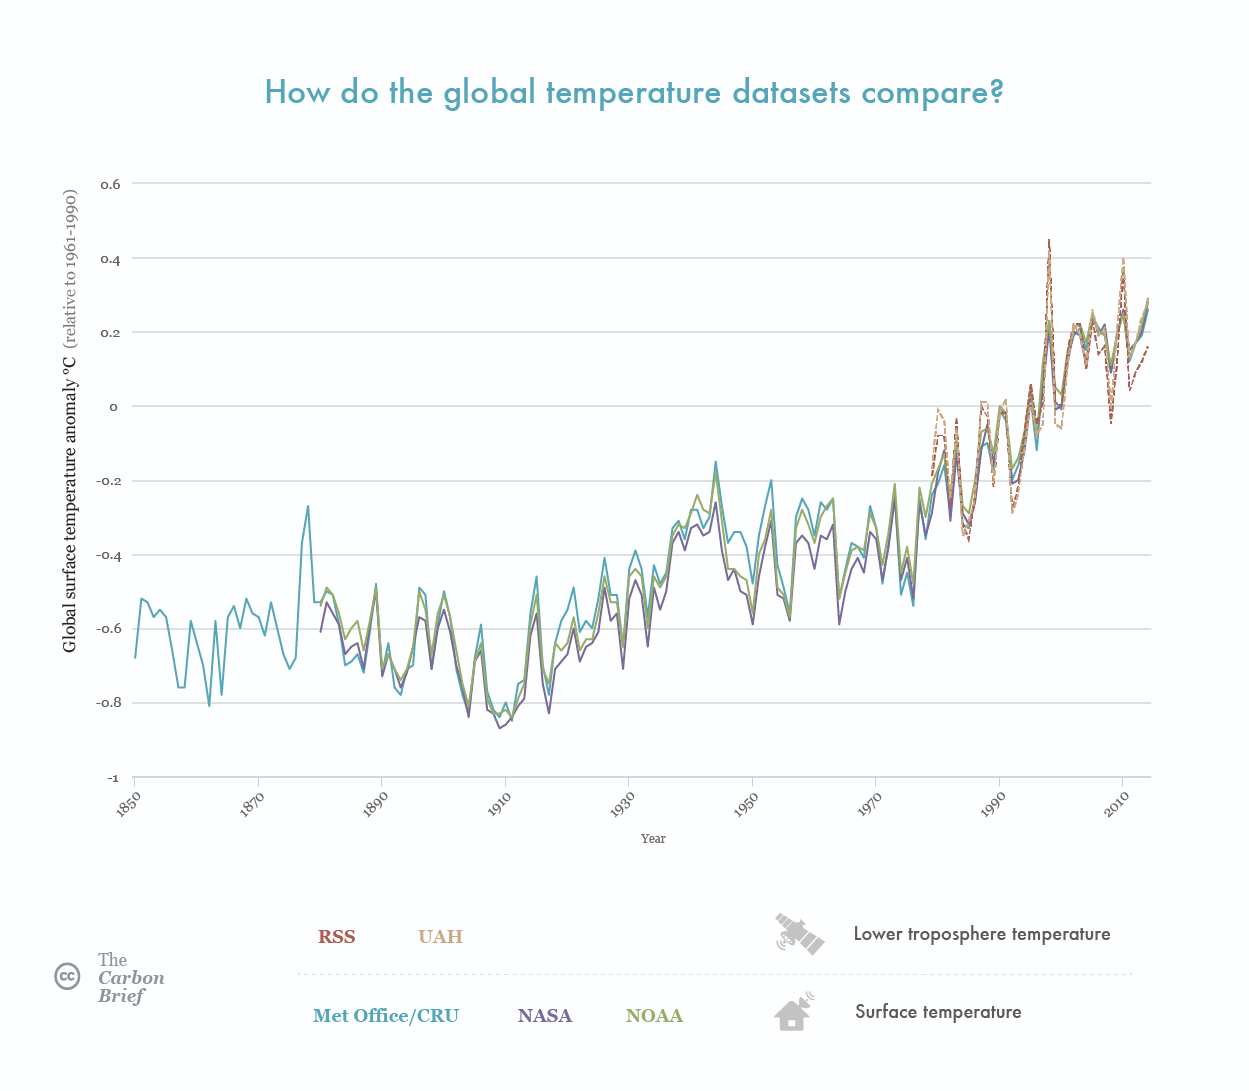
Global average temperature anomalies for the major global surface temperature datasets (Met Office/CRU, NASA and NOAA) and the tropospheric temperatures (RSS and UAH). All temperatures are relative to 1981-2010 average. Source: Rosamund Pearce, Carbon Brief
As part of its inquiry, the GWPF is calling anyone who has special knowledge of temperature data to begin submitting evidence. Muller has told Carbon Brief he won’t be making a formal submission, although other members of the BEST team might do.
With BEST having already covered much of the same ground as the new inquiry, the Mullers have given Carbon Brief answers to each one the five questions the GWPF poses.
Here are their comments in full:
1. Are there aspects of surface temperature measurement procedures that potentially impair data quality or introduce bias and need to be critically re-examined?
“There were aspects of prior studies that could potentially impair data quality, and we did such a re-examination in our studies. Our broad conclusion: the data are indeed adequate to reach the conclusions that we reached (which are substantially the same, except for some details, with the conclusions of the other groups (NASA, NOAA, HadCru).
“For discussion of the heat island effect, see here; for questions of station quality, see here; for the explanation of the method of correction, see here; for other adjustment in the land data see here and here.
2. How widespread is the practice of adjusting original temperature records? What fraction of modern temperature data, as presented by HadCRUT/GISS/NOAA/BEST, are actual original measurements, and what fraction are subject to adjustments?
“From a scientific point of view, it would be irresponsible NOT to adjust. There are cases in which the temperature suddenly jumps from Celsius to Fahrenheit – and ignoring that would be unjustifiable. Another example: when measurements on ships were suddenly shifted from buckets to boat inlets, there was a sudden and significant jump in the value of the temperatures being recorded. It would have been inexcusable to ignore that. If we had, our papers would have been rejected by any reputable scientific journal.
“What Berkeley Earth did was to avoid totally any human intervention and to make all adjustment automatic. Our adjustment program has been put online for all to see. In addition, we put the data online in its original as well as adjusted form, so everyone can see what the automated programs did.
“Furthermore, because of the interest, we re-analyzed all the data with ZERO adjustments, just to see what we would get. These results have been made available online. What we found was that the conclusions we had previously drawn were unchanged. The data are available here.” [CB note: The raw station data is available in the ‘source’ and ‘intermediate’ sections on this page. BEST does not publish the raw gridded data.]
3. Are warming and cooling adjustments equally prevalent?
“Not exactly. When we turn off all adjustments, we find a slightly GREATER global warming than without! The main effect comes from the ocean data, which is the most difficult to adjust. Take out adjustments, and global warming is stronger; but that is not scientifically justifiable.”
4. Are there any regions of the world where modifications appear to account for most or all of the apparent warming of recent decades?
“For large regions, I think not. For individual sites, yes. But keep in mind a number we have published: A third of all sites show cooling over the past 100 years! That’s because regional variations are huge. People often write to us and say they have found three sites where cooling dominates; we write back and say we can give you 10,000. For a map of the cooling sites in the US, see Figure 4 here.
“Small regions are dominated by local climate effects. No global conclusion can be drawn from local sites. You have to average hundreds, if not thousands of sites in order to average out the local climate variations. Keep in mind that 1.5 C is very small and difficult to detect.
“Zeke Hausfather, one of our scientists, did some analysis of results by region, which is available here.”
5. Are the adjustment procedures clearly documented, objective, reproducible and scientifically defensible? How much statistical uncertainty is introduced with each step in homogeneity adjustments and smoothing?
“ Our adjustments are all public . They are objective, reproducible, and scientifically not just defensible but essential. As I said earlier, it would be considered poor science to avoid such corrections. Fortunately, as I also said earlier, they do not affect the substantial results, which are.
-
Global warming is real, about 1.5 Celsius for land measurements over the past 250 years. (Note that Berkeley Earth goes substantially further back in time than do the other studies.
-
The match to the record of log(CO2) is excellent, better than we obtain with pure math functions (e.g. exponential, parabola) or other indications of world growth (e.g. world population).
-
The correlation with solar variations is very small, less than 5% (at the 95% confidence level). This effectively rules out solar variability as a cause. We draw a stronger conclusion here than does the IPCC because our data goes back 250 years, and that allows the stronger correlation.
-
The correlation with volcanic activity is strong, but only in short-lived events. Our analysis clearly shows that the volcanic component did not contribute to the warming trend.
-
We can eliminate all theories that are capable of making predictions, namely, the solar theory and the volcanic theory and the orbital change (Milankovitch) theory. Note that we are also experts on the orbital theories (having written a technical book on the subject) and can rule them out too. Of course, speculations that there is something else going on which just happens to match the CO2 records can not be ruled out, but it begs the question of why the “unknown” happens to match CO2. Moreover, from simple back-of-the-envelope equations developed long before the warming was seen, we believe that what we are seeing is in the right ballpark to be due to CO2 with water vapor feedback.
“Based on this, we see no competition to the conclusion that global warming is small (1.5 C land over 250 years) but real, and caused by greenhouse gas increases. Speculation that is it not is not based on science in the sense that the competing theories don’t make predictions or testable patterns of behavior. They are not “falsifiable” in the sense of Karl Popper’s fundamental criterion for distinguishing science from non-science.
“Note that we do not claim that “climate change” including droughts, storms, etc is caused by greenhouse gases. We only address global warming. Moreover, as we have written in our memos and Op Eds, the current “pause” in warming is not statistically significant when looked at in light of the kind of variability that has been observed over the last century, likely caused (as we show in one of our published papers) by variations in the flow of ocean currents.
Update: This article was last modified on 4 Feb 2016 to include a link to the raw, unadjusted BEST station data. BEST does not publish the raw gridded data.
-
Prof Richard Muller: Not adjusting global temperature records would be "poor science"