Roz Pidcock
24.04.2014 | 12:50pmForecasters worldwide are issuing alerts. Later this year, we’re likely to be in the midst of an El Niño – a phenomenon driving severe weather worldwide. So when can we expect it to kick in, and what will the consequences be for global temperature? Find this and more in our quick Q & A.
What is an El Niño?
Every five years or so, a change in the winds causes a shift to warmer than normal ocean temperatures in the equatorial Pacific Ocean – known as El Niño, or cooler than normal – known as La Niña, moving briefly back to normal in between.
Both phases together are known as the El Niño Southern Oscillation (ENSO), and are responsible for most of the fluctuations in global weather we see from one year to the next.
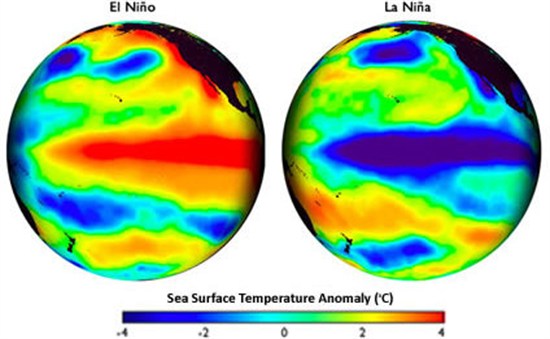
Sea surface temperature during El Niño (left) and La Niña (right). Red and blue show warmer and cooler temperatures than the long term average. [Credit: Steve Albers, NOAA]
What happens when an El Niño hits?
Each time a switch occurs, changes in the ocean and atmosphere above affect global temperature and rainfall patterns worldwide.
In El Niño years, Indonesia and Australia see below average rainfall, while South America and parts of the United States see more than usual.
The ocean releases heat into the atmosphere in El Niño years. Added to the warming we’re already seeing from greenhouse gases, this puts El Niño years among the warmest on record.
You can see this in the graph below showing global temperature between 1950 and 2013. Five of the top ten warmest years are El Niño years (orange bars).
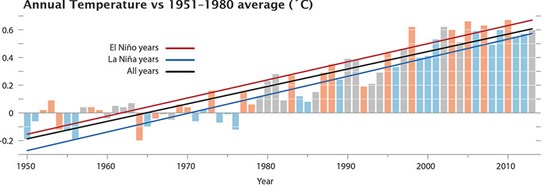
Global temperature anomalies for 1950-2013 showing the phase of the El Niño-La Niña cycle (Credit: NASA/GSFC/Earth Observatory, NASA/GISS)
While El Niño boosts surface temperatures, La Niña does the opposite. In La Niña years, warm water is carried to deeper ocean layers, which allows heat to enter at the surface, cooling the atmosphere.
Scientists think a prevalence of La Niñas in the last 15 years (blue bars above) could partly explain why surface temperatures have risen more slowly than in previous decades. By contrast, the period between about 1980 and 2000 experienced several El Niños and rapid surface warming.
Scientists think the prevalence of El Niño or La Niña is driven by a switch between the positive and negative phases of a larger natural cycle known as the Interdecadal Pacific Oscillation.
You can see different rates of warming in the graph below of global temperature (top). Note that despite slower warming recently, the last decade was the warmest on record (bottom).

Global temperature anomaly between 1850 and 2012 (relative to 1961 to 1990 average). Source: IPCC AR5 WG1 Summary for Policymakers.
When will the next El Niño be?
Since the last El Niño in 2009/2010, the Pacific has been in neutral or La Niña phase. The current neutral phase has persisted for most of 2012, all of 2013 and 2014 so far. This might suggest we’re due an El Niño – and scientists are seeing signs that one is indeed on its way.
The Australian Bureau of Meteorology says an El Niño this year is “likely”. The signature warming in the Pacific is underway and looks set to continue in the coming months. A statement says:
“The likelihood of El Niño remains high, with all climate models surveyed by the Bureau now indicating El Niño is likely to occur in 2014. Six of the seven models suggest El Niño thresholds may be exceeded as early as July.”
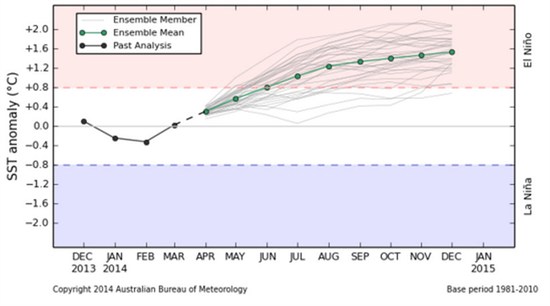
Climate models predict when temperatures in the Pacific will enter El Niño conditions (red). The model average (green line) suggests as early as June. Single model runs are shown in grey. Source: Australian Bureau of Meteorology
Earlier this month, the US Climate Prediction Centre upped its prediction of the chances of an El Niño this year from 52 per cent to 65 per cent. And last week, the International Research Institute (IRI) for Climate and Society at Columbia University put the odds at 75 to 80 per cent for an El Niño developing this autumn, up from 60 per cent in its March forecast.
How strong will the next El Niño be?
It’s still too early to tell whether the next El Niño will be weak, moderate or strong, according to the IRI website:
“During April, May, and June, the state of the central Pacific is dynamic and can change quickly, making it hard to predict how it will behave in the coming months. In June, predictability of the El Niño, including its potential strength, will become more certain.”
IRI’s chief forecaster, Tony Barston, explains more in this video.
April Climate Briefing Highlights, with Tony Barnston from IRI on Vimeo.
Will we see the hottest year on record?
Scientists suggest the next El Niño, on top of continuing greenhouse gas warming, could see surface temperatures topping the charts for the warmest year on record.
Professor Mat Collins from Exeter University tell us conditions in the Pacific resemble those before the last big El Niño in 1997/8, though that doesn’t guarantee it’ll be as large. He adds:
“However, the influence of El Niño on global mean temperatures is well known so my guess is the chance of seeing a record warm year is pretty high, especially if it is a large event”.
As the graph above shows, the El Niño peak is unlikely to occur before the end of this year. So if we do see record temperatures, it could well be in 2015.
Are El Niños getting stronger?
Recent research suggests ENSO events have been unusually strong in the later part of 20th century compared to the past 7,000 years – 42 per cent stronger, on average.
The jury’s still out on whether there’s a definitive link, but professor Kim Cobb from Georgia Tech university told us recently how human-caused warming could increase the strength of ENSO:
“[C]limate change is much more than ‘global warming’ [â?¦]. Because ENSO involves feedbacks between the wind strength, ocean temperature, and circulation, a change in any related climate parameter would arguably have some effect on ENSO strength”.
Big picture
Natural fluctuations in the climate produce warming or cooling effects on top of the long term global warming trend – and the ENSO cycle is a powerful example of that. It’s why we should expect to see ups and downs in the temperature record, not a smooth upward trend from one year to the next.
The next El Niño could well be the warmest year on record, scientists are saying. And if it is, it’s likely to bring extreme weather across the world as well as marking a departure from the slower surface warming we’re experiencing now.
But a single year doesn’t prove or disprove a trend – it’ll take more than one year to signal a return to a more rapid phase of warming, like we saw up to 2000.
Perhaps the more salient point from discussions over whether we’ll get an El Niño is how different short term trends can look, depending on where in various cycles of natural variability you pick your start and end points. But if you take a step back, the long term trend is clearly one of warming.