Record 2017 hurricane season driven by warm Atlantic Ocean, study says
Daisy Dunne
09.27.18Daisy Dunne
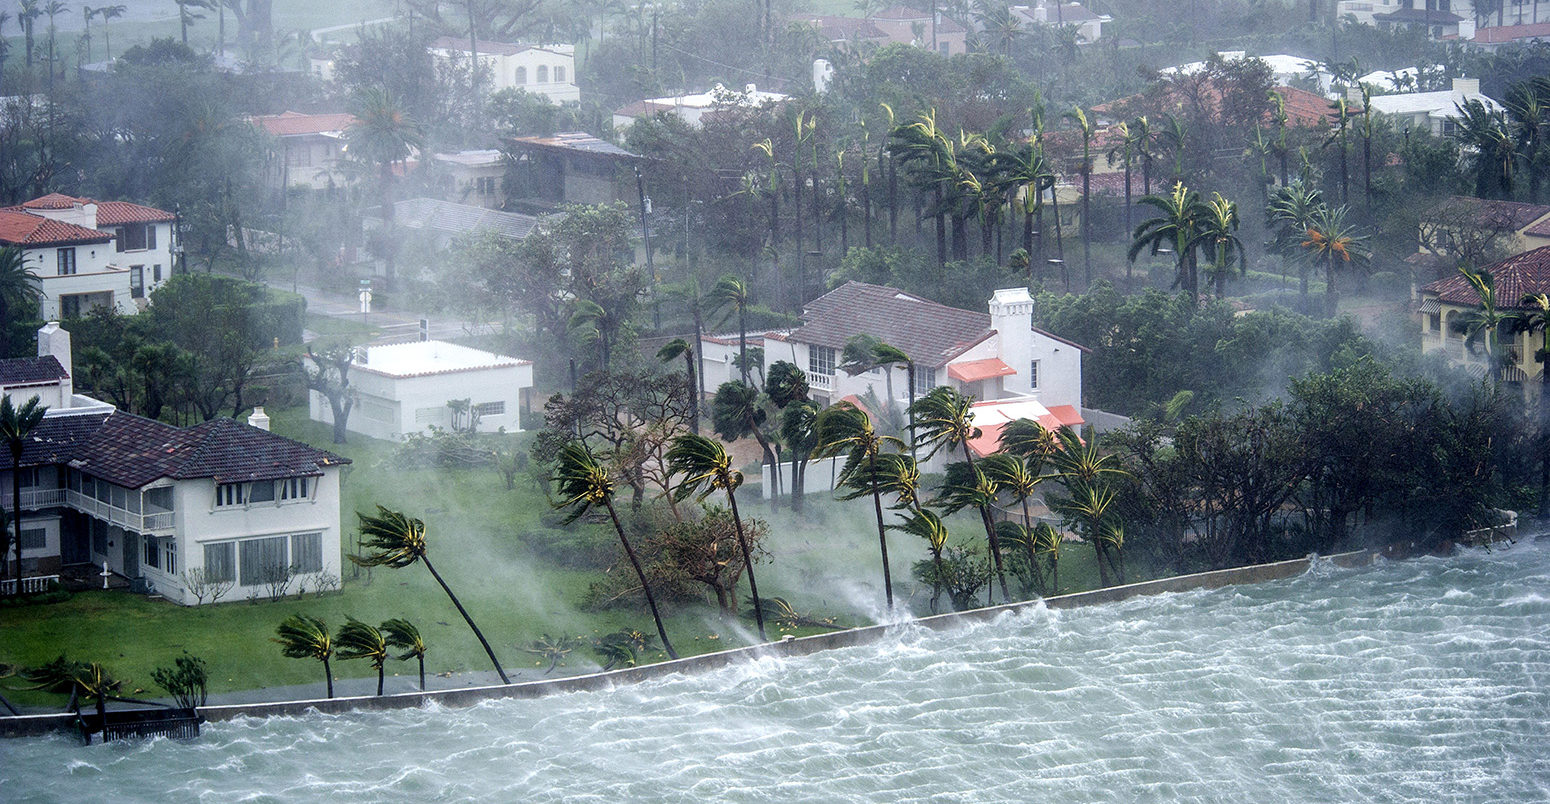
27.09.2018 | 7:00pmLast year’s record hurricane season – which saw Hurricane Harvey, Irma and Maria cause devastation across North and Central America – was primarily driven by “pronounced warm conditions” in the tropical Atlantic Ocean, research finds.
The study shows that high sea surface temperatures (SSTs) in the Atlantic played a larger role than other possible drivers, such as La Niña, a natural climate phenomenon that is known to affect hurricane seasons, and air pollution.
Climate change is likely to have played a role in driving the unusually warm Atlantic, the lead author tells Carbon Brief, although natural factors could have also had an influence.
The research also finds that hurricanes on a similar scale to those of 2017 could become 1.5-2 times more frequent by 2080 – depending on how much action is taken to tackle climate change.
Record rain
The 2017 Atlantic hurricane season featured 17 named storms, 10 hurricanes and six “major” hurricanes (category three or higher). Although the season runs from the beginning of June to the end of November, September alone saw more days with hurricanes and major hurricanes than any other month on record.
Three of the major hurricanes made landfall over the US, the Caribbean and parts of Central America – Harvey, Irma and Maria. Between them, they killed at least 3,300 people and contributed to the season being the costliest on record, causing more than $200bn in damages.
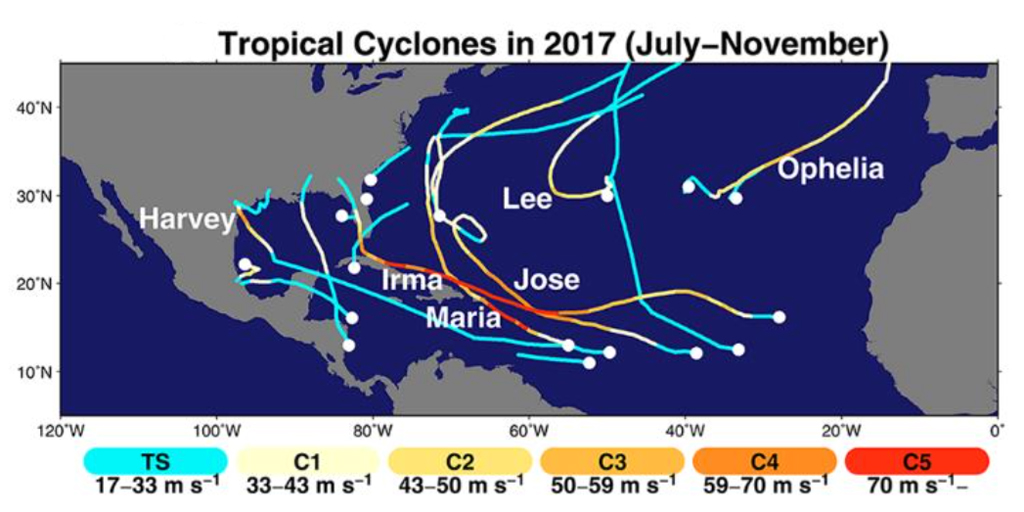
The paths travelled by tropical storms (blue) and hurricanes (categories one to five; yellow to red) during the 2017 Atlantic hurricane season. Source: Murakami et al. (2018)
Previous research suggests that climate change is likely to have played a role in driving the extreme rainfall brought by Hurricane Harvey.
The new research, however, looks at what could have caused the entire season to be so extreme.
The findings, published in Science, show that unusually warm sea surface temperatures in the tropical Atlantic Ocean likely played the chief role, says lead author Dr Hiroyuki Murakami, a researcher at the Geophysical Fluid Dynamics Laboratory, which works in cooperation with the National Oceanic and Atmospheric Administration (NOAA). He tells Carbon Brief:
“[Our] simulations pinpoint the unusual warmth in the tropical Atlantic, relative to the rest of the global ocean, as the main cause of the active season – rather than moderate La Niña conditions.”
Finding the cause
To find out what could have caused the hurricane season to be so severe, the researchers used a high-resolution weather prediction model called HiFLOR.
The researchers began running the model during the 2017 hurricane season and found that it was able to replicate the spatial distribution of hurricanes with a large degree of accuracy. It also successfully predicted an increase in hurricane density, although it did underestimate how many storms would occur.
This is shown on the charts below, which show the observed (top) and predicted (bottom) major hurricane density. On the charts, red and yellow show patches where major hurricane density is high, while dark blue, purple and green show where hurricane density is low.
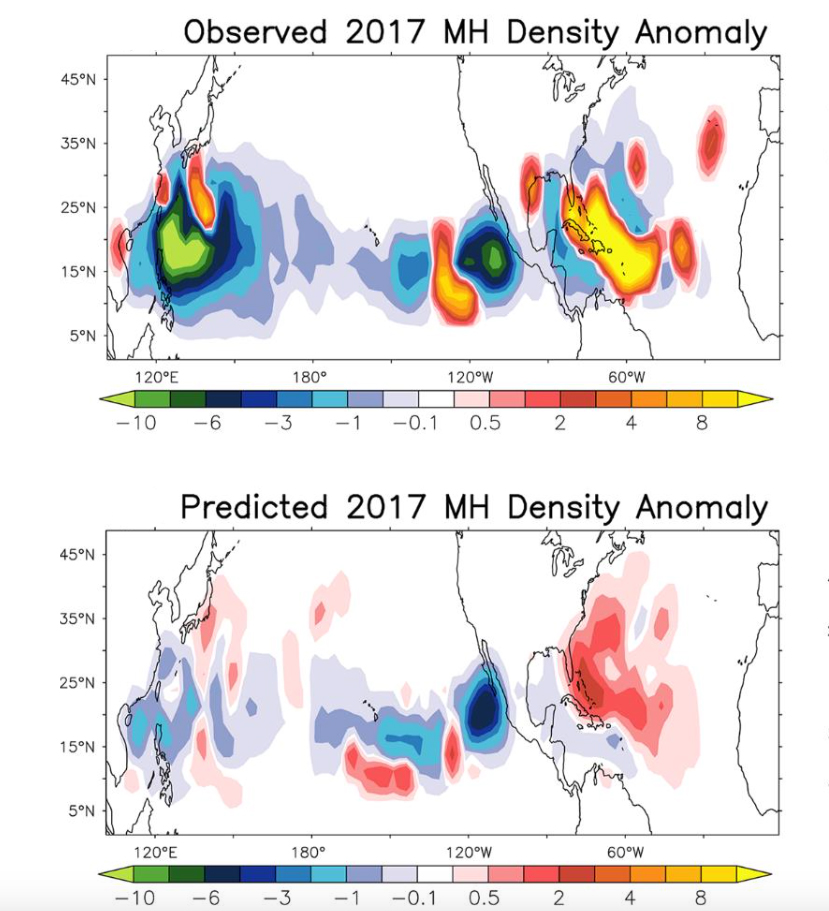
A comparison of the observed (top) and predicted (bottom) major hurricane (MH) density over the tropical and sub-tropical Atlantic and Pacific during the 2017 hurricane season, relative to the average during 1980-2017. Red and yellow show patches where major hurricane density is high, while dark blue, purple and green show where hurricane density is low. Source: Murakami et al. (2018)
The charts show how the tool was able to successfully predict the high density of major hurricanes over the Caribbean and Florida.
To tease apart the possible drivers of the severe season, the research team then used the model to run a series of experiments.
![]()
In one experiment, they ran the model as normal but removed the climate impacts caused by La Niña. La Niña is the lesser-known sister of the natural climate phenomenon El Niño; it generally brings cooler SSTs to the eastern and central Pacific Ocean, with knock-on impacts for weather around the world.
At the time of the hurricanes, the Pacific Ocean was experiencing a developing moderate La Niña event. This could have caused winds to weaken over the tropical Atlantic, Murakami says, which could have made hurricanes more active over the North Atlantic.
The researchers reasoned that, if La Niña was the chief driver of the major hurricane season, removing its effects from the model would cause the number of major hurricanes to fall.
However, removing the impacts of La Niña did not impact the number of major hurricanes, leading the researchers to conclude that “the moderate 2017 La Niña conditions were not the key factor for the highly active major hurricane season in 2017.”
Scorching seas
In a second experiment, the researchers removed the unusually high SSTs in the tropical Atlantic from the model – replacing them with the average temperatures expected in the region during 1982-2012.
There are two main reasons why the high SSTs could have boosted the number of major hurricanes, Murakami says.
First, warmer sea temperatures provide more energy and moisture to hurricanes as they travel over water.
Second, and more importantly, the warming caused temperatures in the Atlantic to be higher than other world oceans, Murakami says. This large difference between oceans could have caused the atmosphere to become more unstable, leading the winds that carry hurricanes to become stronger.
They found that removing the high sea temperatures from the experiment caused “significant reductions in both major hurricane number and density”. This suggested that the “the local Atlantic sea surface temperature anomaly was critical for the high major hurricane activity in 2017.”
However, it is still not clear to what extent to which climate change could have influenced the Atlantic Ocean warming, Murakami says:
“The effect of anthropogenic forcing [human influence] on sea surface temperature is difficult to be distinguished from natural variability so far. However, our experiments suggest that the effect of anthropogenic forcing actually leads to larger warming in the tropical Atlantic than the rest of the tropics and that, in turn, leads to an increase in major hurricane frequency. Therefore, the effect of anthropogenic forcing should not be neglected.”
In a third experiment, the researchers looked at the impact of sharp declines in air pollution over the North Atlantic. They found the declines caused a small – but not significant – increase in major hurricanes during the 2017 season.
Hurricane warning
![]()
To look into the future, the researchers introduced expected changes in temperature from present day until 2080 into their predictive tool.
They studied temperature change under two different scenarios – a moderate greenhouse gas emissions scenario (“RCP4.5”) and a high emissions scenario (“RCP8.5”).
![]()
The results show that, by 2080, major hurricanes in the Atlantic could become 1.5 times more frequent under the moderate scenario and twice as frequent under the high emissions scenario.
The findings suggest that failing to take action on climate change could lead to more frequent and more costly hurricanes in the coming decades, Murakami says:
“We clearly see in the climate model that major hurricanes could be more active in terms of both frequency and intensity in the future than the recent decade. Thus, continued anthropogenic forcing has the potential to further amplify the risk of major hurricanes in the North Atlantic, with corresponding socio-economic implications.”
However, the research may have overestimated the role of SSTs in hurricane formation by overlooking the importance of heat stored below the ocean’s surface, says Prof Kevin Trenberth, a senior scientist at the National Center for Atmospheric Research (NCAR) in Colorado, who was not involved with the research. He tells Carbon Brief:
“The comments related to the future are reasonable and provide a much needed warning. However, they talk about SSTs but not ocean heat content. They missed the boat.”
In May, Trenberth and colleagues published a paper which noted that, during the hurricane season, ocean heat content – a measure of the heat stored below the ocean surface – was the highest on record both globally and in the Gulf of Mexico.
This record warming could have greatly boosted Hurricane Harvey’s extreme rainfall, they say:
“Record high ocean heat values not only increased the fuel available to sustain and intensify Harvey but also increased its flooding rains on land.”
Murakami, H. et al. (2018) Dominant effect of relative tropical Atlantic warming on major hurricane occurrence, Science, doi/10.1126/science.aat6711
-
Record 2017 hurricane season driven by warm Atlantic Ocean, study says
-
Warm Atlantic Ocean chief driver of 2017 hurricane season, study says