
Scientists confirm multiple climate records broken in 2015
Robert McSweeney
08.02.16Robert McSweeney
02.08.2016 | 4:44pmLast year saw records in the Earth’s climate system continue to tumble, says the latest State of the Climate report from the US National Oceanic and Atmospheric Administration (NOAA).
The 300-page report, now in its 26th year, is an annual assessment of the world’s climate, scrutinising the Earth’s land, oceans, ice and atmosphere. It is compiled by more than 450 scientists from 62 countries.
Carbon Brief takes a look at how rising greenhouse gas emissions, with the help of a strong El Niño event, made 2015 into a record-breaker.
Greenhouse gases
Last year was record-breaking for concentrations of all three of the main long-lived greenhouse gases that contribute to climate change: carbon dioxide (CO2), methane (CH4), and nitrous oxide (N2O).
At the Mauna Loa Observatory, where scientists have been monitoring CO2 since the 1950s, the average concentration for the year as a whole surpassed 400 parts per million (ppm) for the first time. At 400.8ppm, CO2 levels in the atmosphere were 3.1ppm greater than 2014 – the largest annual increase of the 58-year record.
In addition, March 2015 was the first time average CO2 concentration across the globe has been more than 400ppm for an entire month. Global annual average CO2 levels for 2015 finished just shy of the 400ppm milestone, at 399.4 ppm. You can see this in the chart below, one of several graphics produced alongside the report.
Meanwhile, levels of both methane and nitrous oxides reached new record highs in 2015, at 1834.0 parts per billion (ppb) and 328.2ppb, respectively.

Global average carbon dioxide concentrations since 1958, with Arizona’s coal-fired Cholla power plant in the background. Credit: NOAA Climate.gov, based on data from ESRL’s Global Monitoring Division. Photo by John Fowler available through a Creative Commons license.
Global surface temperature
As was widely reported in January, observations show that 2015 was the hottest year on record.
The 2015 globally averaged surface temperature was 0.42-0.46°C above the 1981–2010 average, topping the previous record set in 2014 by 0.13-0.18C. The range in values reflect the different datasets used by various meteorological agencies to calculate global temperature.
2015 was also the first year to see average global temperatures surpass 1C above pre-industrial levels. 14 of the 15 warmest years on record have now occurred since the beginning of the 21st century, the report notes, with 1998 the only exception.
![]()
The strong El Niño event in the Pacific Ocean contributed to the record global temperatures, the report says, though it does not quantify by how much. Prof Adam Scaife, head of long-range forecasting at the Met Office, told Carbon Brief earlier this year that El Niño made a contribution of only a few hundredths of a degree to the 2015 record.
El Niño is expected to have more of an impact on 2016’s average temperature, Scaife noted, contributing “around 25% to what will most likely be a new record global temperature in 2016.”
Across the global land surface, record or near-record warmth was reported across every inhabited continent, the report says. Twelve countries – such as Russia and China – reported record high annual average temperatures.

Top: Average surface temperatures for 2015, against a baseline of 1981-2010. Shading indicates where temperatures are above (red) or below (blue) average. Bottom: Global temperature since 1880 for the surface (dark red line) and the troposphere (pale red line), against a baseline of 1981-2010. Credit: NOAA Climate.gov
Land temperatures in 2015 saw a record number of warm days – which are days where the maximum temperature reaches the top 10% for the average for that season during 1961-90. Globally, 2015 saw almost twice the number of warm days than the annual average for 1961-90.
There were also a record low number of cool days in 2015. These are days when the maximum temperature doesn’t rise above the chilliest 10% of days for that season during 1961-90. There were almost half the number of cool days in 2015 than the average for 1961-90.
Oceans
As well as above the surface, 2015 was a record year for the world’s oceans.
Global sea surface temperatures (SSTs) in 2015 were 0.33-0.39C above the 1981-2010 average, surpassing the previous record set in 2014 by 0.10-0.12C. The strong El Niño during 2015 contributed to record high SSTs across much of the tropical Pacific Ocean, the report notes, which boosted global SSTs. You can spot the El Niño event in the map below by the warm SSTs in the central and eastern tropical Pacific Ocean.
The whole of the top 700m of the world’s oceans saw record warming in 2015, exceeding the record set in 2014. As oceans absorb over 90% of the heat trapped by the Earth’s atmosphere, the level of warming reflects the continuing accumulation of heat in the upper layer of the oceans, the researchers say.

Top: Global map of upper ocean heat content in 2015. Shading indicates where ocean heat content is below (blue) or above (orange/red) average. Bottom: Graph of heat content for the upper ocean (red line) and deep ocean (blue line) since 1993. Credit: NOAA Climate.gov
Warming ocean temperatures also contributed to global sea levels hitting new heights last year. Water expanding as it warms is one of several different components of sea level rise, along with melting glaciers and ice sheets, and changes to how much water is stored on land.
In 2015, global sea level was approximately 70mm higher than when the satellite record began in 1993. This is, in part, down to the long term rising trend of 3.3mm per year plus the effect of the strong El Niño, which boosted sea level in 2015 by an extra 10mm.
During El Niño events, rainfall over the oceans tends to increase (pdf), while decreasing over land. This reduces the amount of water stored on land, temporarily adding to sea levels. You can see from the map below that sea levels in the central Pacific Ocean were as much as 20cm higher than usual during 2015.
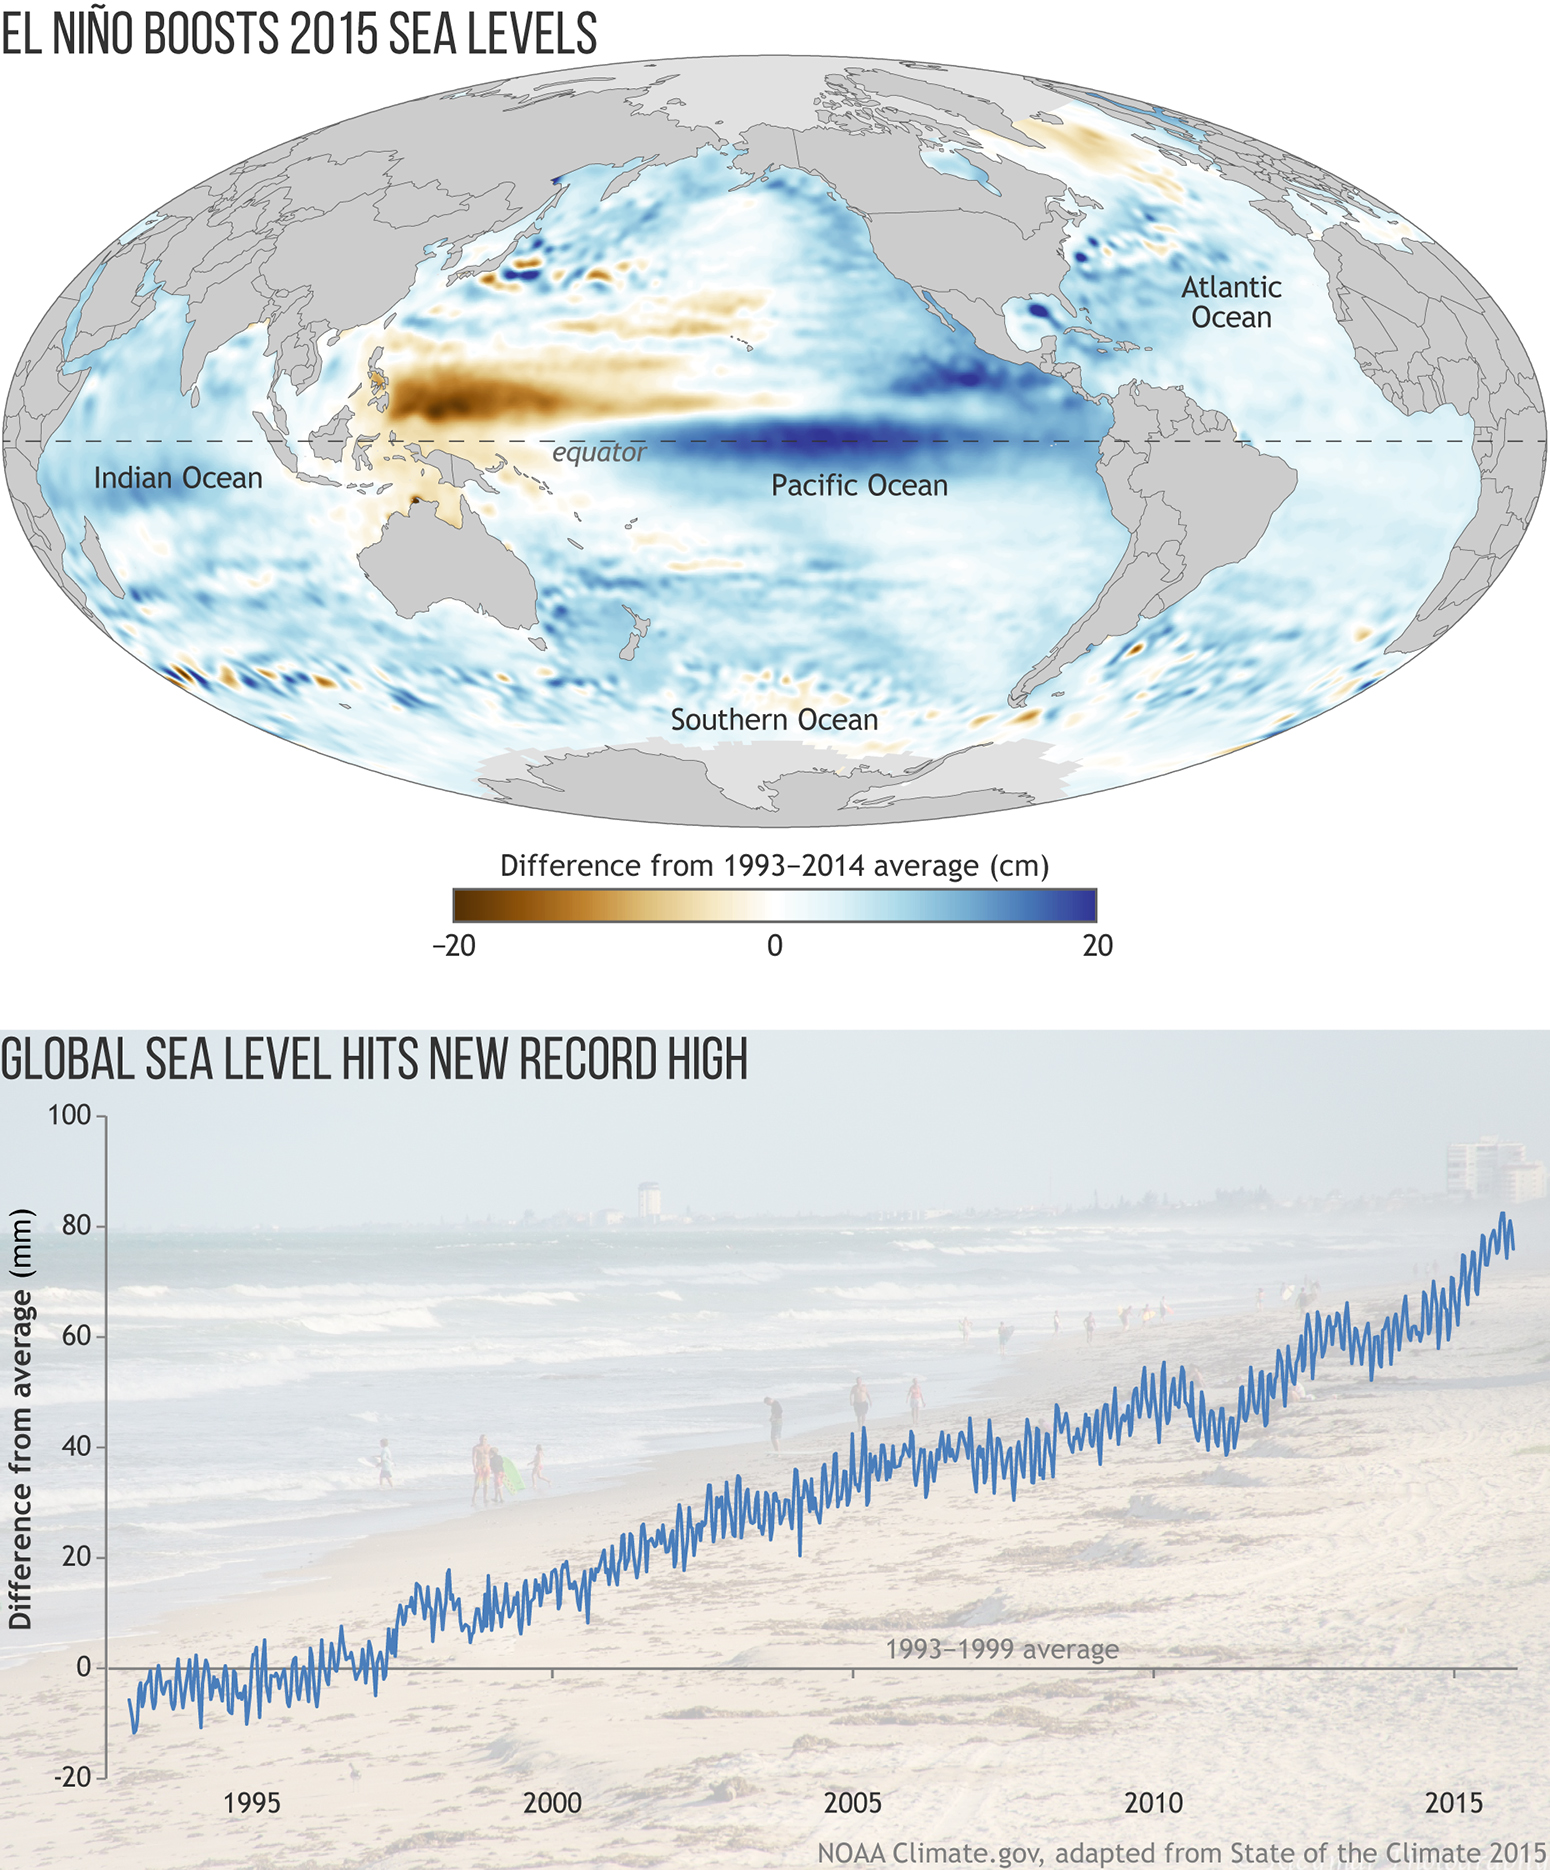
Top: Global sea levels in 2015, compared to a baseline of 1993-2014. Shading indicates areas where sea levels are higher (blue) or lower (brown) than average. Bottom: Global sea levels since the satellite record began in 1993, compared to a baseline of 1993-99. The background photo is of Satellite Beach, Florida. Credit: NOAA Climate.gov, with photo by Roberto Mangual available through a Creative Commons license
Arctic
At 1.2C warmer than the 1981–2010 average, land surface temperatures in the Arctic in 2015 equalled the existing record, held jointly by 2007 and 2011. The Arctic land surface has warmed by 2.8C since 1900, the report notes.
2015 also saw sea ice cover hit its lowest winter peak since the satellite record began, the report says:
The winter maximum, when Arctic sea ice typically reaches its maximum extent, is one of two points each year of particular interest, the report notes. The other is at the end of summer, when the ice reaches its annual minimum extent.
The minimum sea ice extent in September 2015 was 29% less than the 1981–2010 average – the fourth smallest in the satellite record, the report says.
‘Highly significant’
Overall, the report shows that 2015 was yet another highly significant year for the climate, says co-author, Dr Kate Willett, a senior scientist at the Met Office:
As the report runs to almost 300 pages, there are plenty more facts and figures than the selection we’ve picked here. You can find the full-length version on the American Meteorological Society’s website to peruse at your leisure.
Main image: Lijiang Sunrise in Guilin China. Photo: shunjian123/iStock/Getty Images.
Blunden, J. and D. S. Arndt, Eds. (2016) State of the Climate in 2015. Bull. Amer. Meteor. Soc., 97 (8), S1–S275.
-
Scientists confirm multiple climate records broken in 2015
-
NOAA State of the Climate report: Records tumble in 2015