Seven charts show new renewables outpacing rising demand for first time
For the first time ever, investment in new renewables was more than enough to cover rising global electricity demand in 2015.
That’s according to the first World Energy Investment report, published by the International Energy Agency (IEA). While fossil fuels still dominate energy supplies, the IEA says changing investment flows point towards a “reorientation of the energy system”.
Carbon Brief has seven charts showing why the IEA thinks an energy shift is underway.
Energy investment
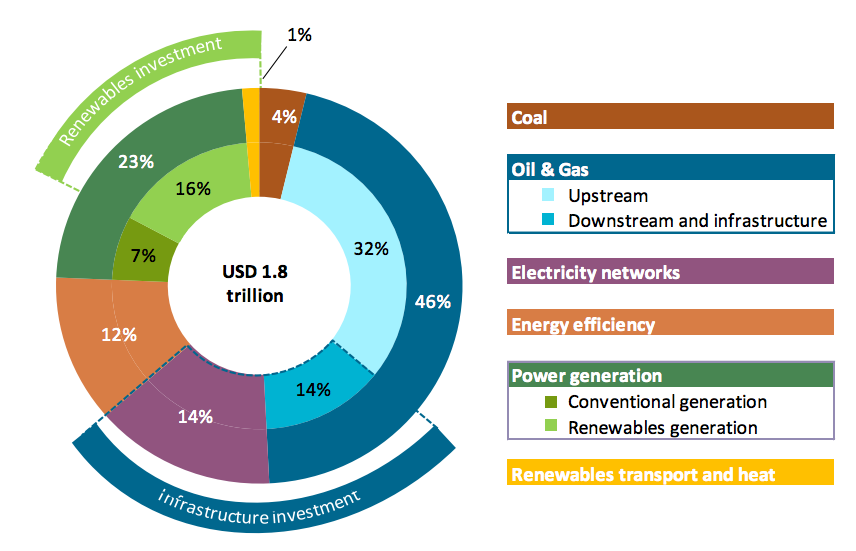
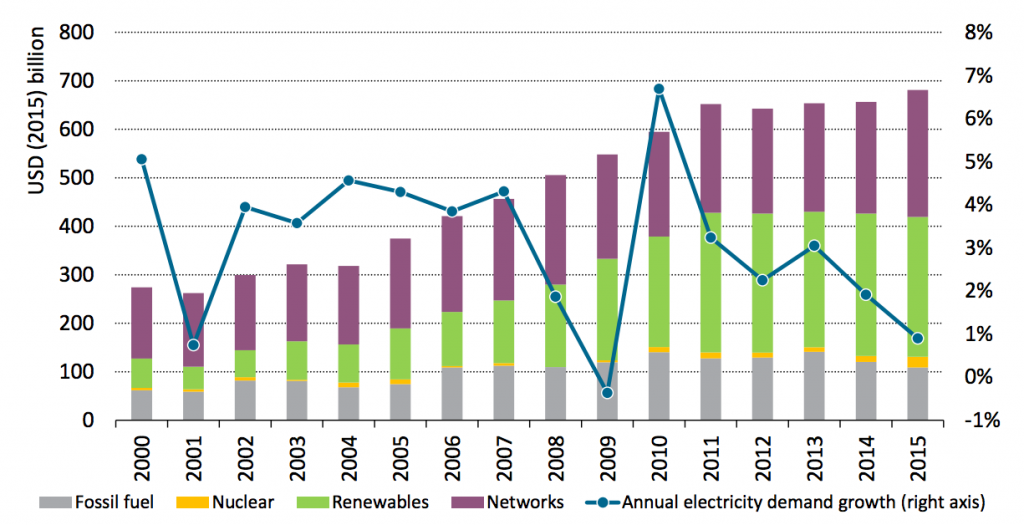
World energy investment amounted to $1.8tn in 2015, the IEA says, equivalent to 2.4% of global GDP. Around half went towards fossil fuel extraction and distribution, mainly for oil and gas.
Renewables accounted for 17% of the total, around $300bn. The vast majority of this was in the electricity sector, where nearly 70% of investment in power stations went towards renewables.
Oil slide
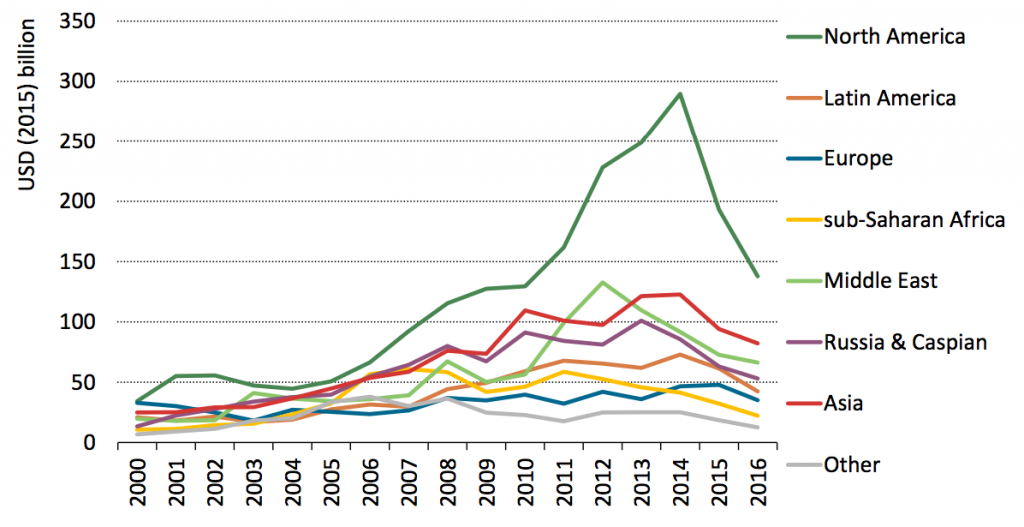
Investment in energy was down 8% year-on-year in 2015 (around $150bn), largely because of falling investment in oil and gas. Soft demand and Saudi Arabia’s determination to squeeze competitors has created a prolonged period of cheap oil that has decimated incomes.
Reductions have been particularly steep in North America, the IEA says, with investment halving in the past two years. The smaller companies that dominate the US shale industry have been particularly hard-hit by the falling oil price, with scores of firms filing for bankruptcy.
Falling costs
The Saudi strategy has only been partially successful. Some two-thirds of the fall in oil and gas investment has been absorbed by cost reductions, particularly in the shale sector. Upstream oil and gas costs fell 15% in 2015, the IEA says.
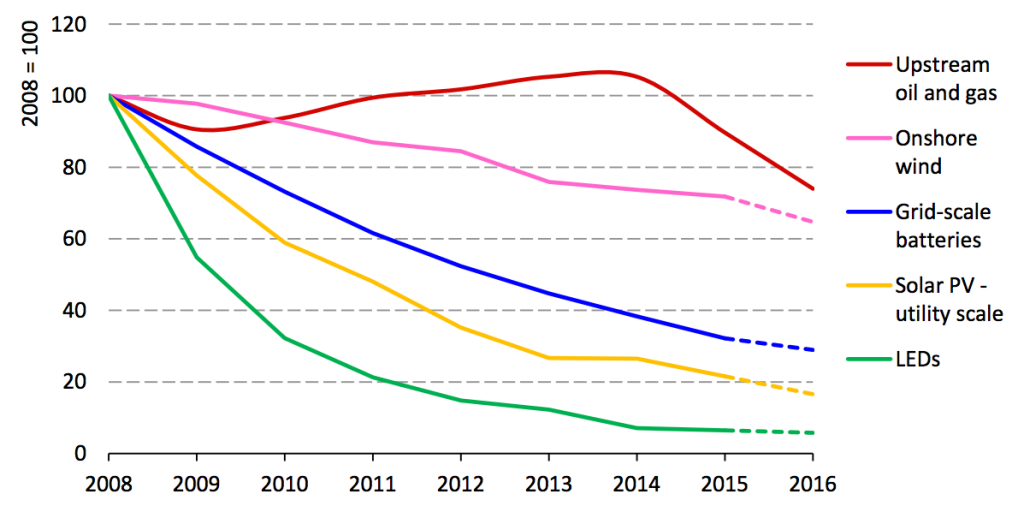
These recent oil and gas cost reductions have been easily outpaced by those for new energy technologies. Costs for onshore wind are down by nearly 40% since 2008, solar by more than 80%, LEDs more than 90% and grid-scale batteries by 70%.
The IEA says renewable costs will continue to fall, while the reverse will be true for oil and gas:
Power shift
The large clean energy cost reductions are behind a continuing shift in the power sector, where 70% of investment in generating assets goes to renewables and fossil fuel investment is in decline.
Renewable power investment held steady at around $290bn in 2015, the IEA says, yet cost reductions mean more capacity could be bought for the money. Solar investment was lower than 2011 in dollar terms, but 60% more capacity was added.
Last year, rising renewable additions combined with weakening power demand growth in a landmark way. The IEA says:
New renewables commissioned in 2015 have the capacity to generate 350 terawatt hours (TWh), against an increase in demand of less than 250TWh. This means all other capacity brought online in 2015 was effectively surplus to requirements.
(It’s worth adding a couple of qualifiers: first, 40% of investment was to replace ageing assets; second, renewables often generate power intermittently rather than on demand).
Net of retirements, nuclear also expanded last year, adding the capacity to generate an extra 50TWh. In total, new plant added in 2015 has the capacity to generate 1,000TWh of electricity a year, more than four times the increase in demand.
Investment in electricity networks is increasing, reaching $260bn last year. This is partly down to the need to incorporate renewables. However, the IEA says around 90% is being driven by the need to expand electricity access and replace old kit.
The network investment figures includes grid-scale batteries. Spending here has risen ten-fold since 2010, the IEA says, though it still amounts to less than 1% of the network total.
Investment map
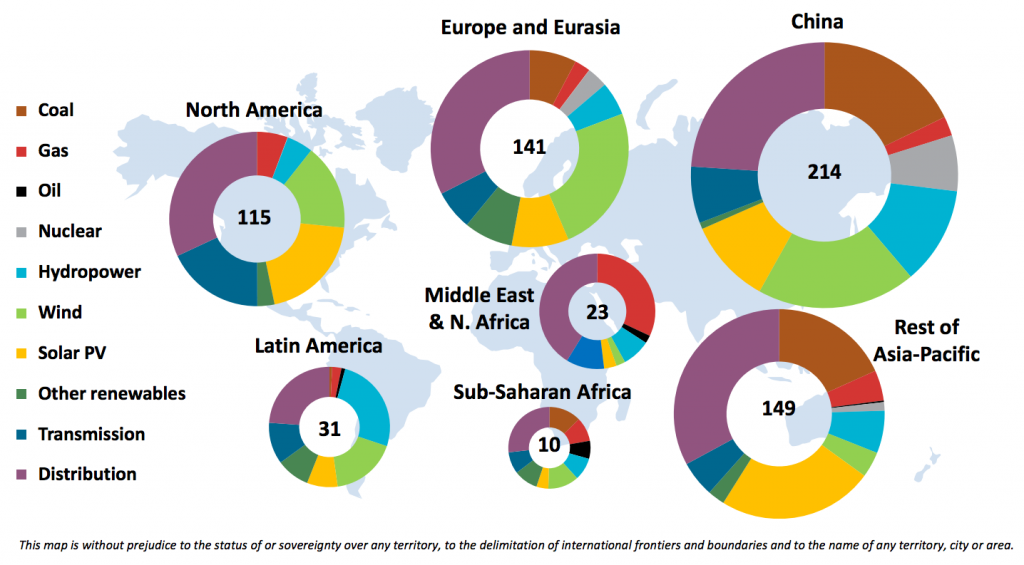
Power sector investments were disproportionately concentrated in China and other Asian countries. The split was particularly stark for new coal-fired generation, where more than 80% of investment was in Asia.
This trend is likely to continue. The IEA says around half of under-construction coal capacity is in China, which added more than 50 gigawatts (GW) of coal plant in 2015.
China stranding
The IEA, in comments that echo recent Greenpeace analysis, says that much of this surge in Chinese coal capacity is unnecessary. It says:
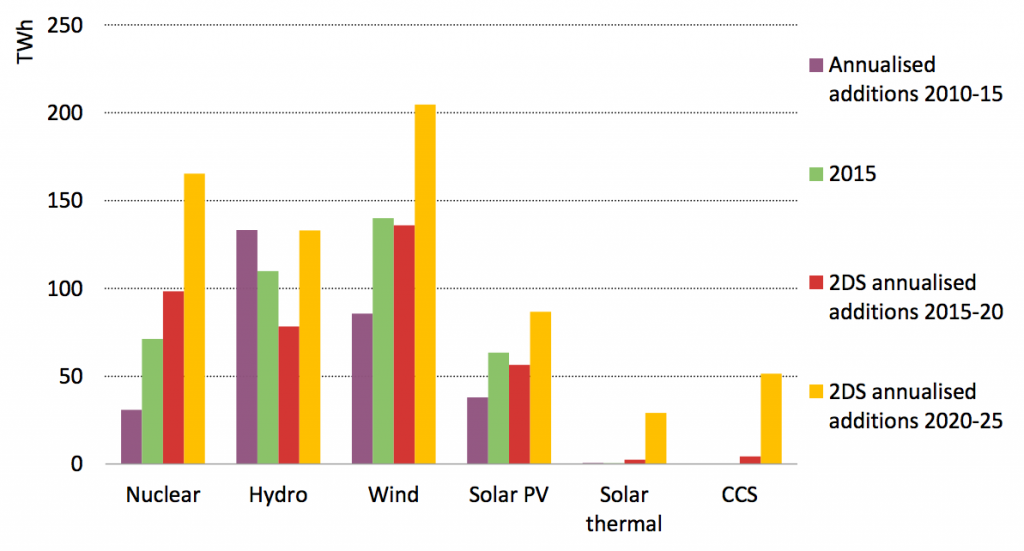
It illustrates the problem with the chart below, which shows falling demand growth being more than covered by consistent expansion of nuclear and renewables.
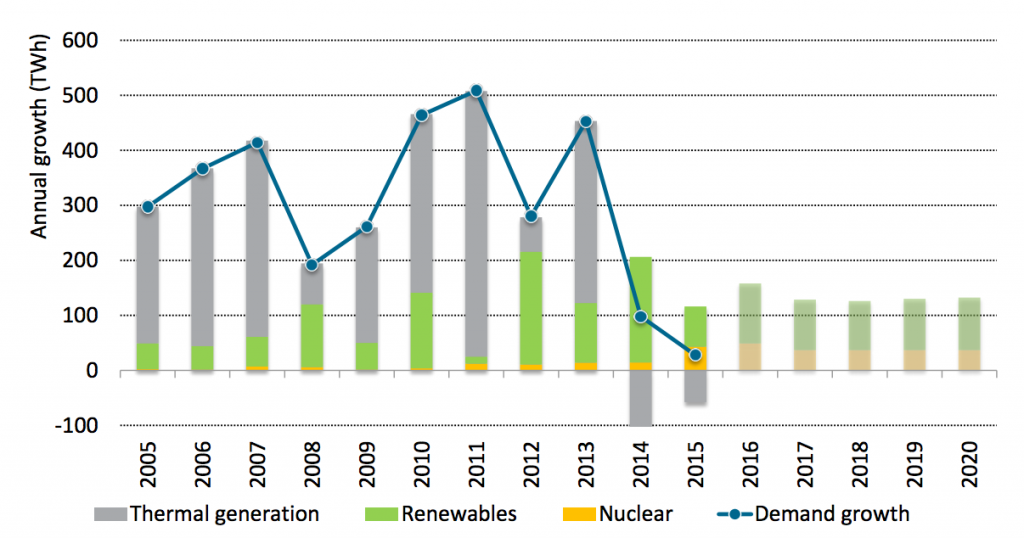
Fossil overinvestment in China, and elsewhere, will lead to stranded assets that become redundant before they have repaid the money spent to build them, the IEA says. It calls Chinese investments “inconsistent with market fundamentals”.
Climate inconsistent
Low-carbon sources of power are on the rise and fossil fuel’s share of the global energy mix is falling. Yet despite identifying a change in direction for energy investment, the IEA says spending on low-carbon will need to increase rapidly over the years ahead if countries of the world are to meet their agreed climate goals.
It concludes: