Seven charts showing how the EU’s energy use is being transformed
Simon Evans
02.10.15Simon Evans
10.02.2015 | 8:00amEU energy use has fallen again, according to the latest official data published. Energy use is now nearly 10 per cent below a 2006 peak and has returned to levels last seen a quarter century ago in the early 1990s.
The sources of the EU’s energy have changed dramatically too, the data shows, with coal and oil use now below 1990 levels. Meanwhile, energy from renewables has surged, with output nearly tripling between 1990 and 2013.
EU energy use is in the midst of a massive transformation as the region works to tackle climate change while replacing ageing energy infrastructure and attempting to minimise costs. Here are seven charts that show what’s going on.
Falling EU energy use
Energy use in the EU fell to 1,666 million tonnes of oil equivalent in 2013, according to the latest data from Eurostat, the European Commission’s statistical body. This is about the same amount of energy as was used back in 1990, a quarter of a century ago. The fall reverses a long-rising trend in energy use, as the chart below shows.
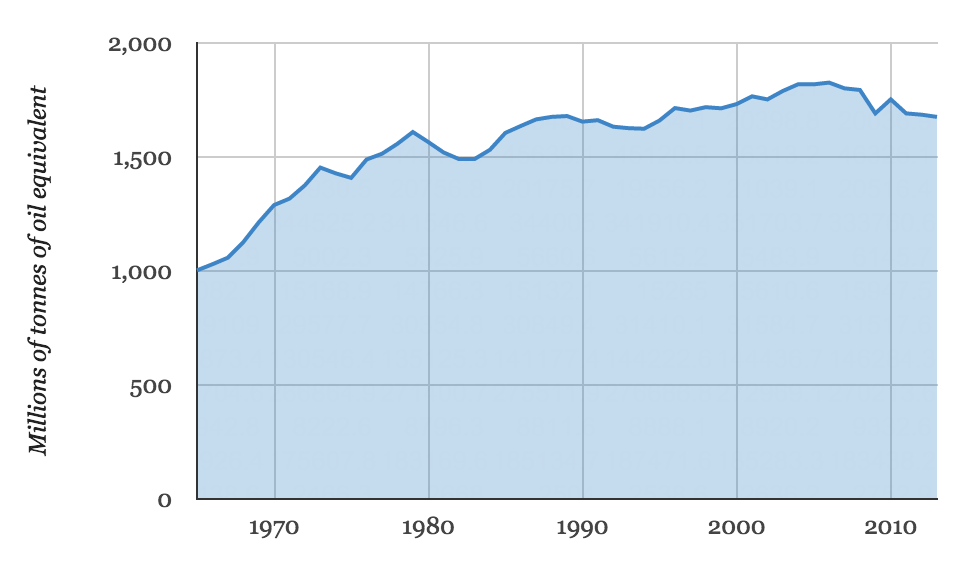
EU energy use. Source: BP Statistical Review of World Energy 2014; chart by Carbon Brief
Back in 1990, the EU accounted for 21 per cent of global energy use. By 2013, that share had fallen to 13 per cent as EU energy flatlined while the rest of the world surged ahead. The EU’s energy use has been eclipsed by China, whose share has climbed from eight per cent to 22 per cent over the same time period.
2020 energy efficiency target
The reduction in EU energy use means the bloc is making steady progress towards its 2020 energy efficiency target. The aim is to drive energy use to 20 per cent below the level projected in 2007.
This is much easier to understand if you look at the chart below. The dark blue line shows actual energy use in the EU, in millions of tonnes of oil equivalent (Mtoe). The light blue line shows the business as usual projection.
The green line shows where the EU will need to get to if it’s going to meet its 2020 energy efficiency target. It’s worth noting that this would be just the start, with the EU having agreed a 27 per cent energy saving target for 2030.
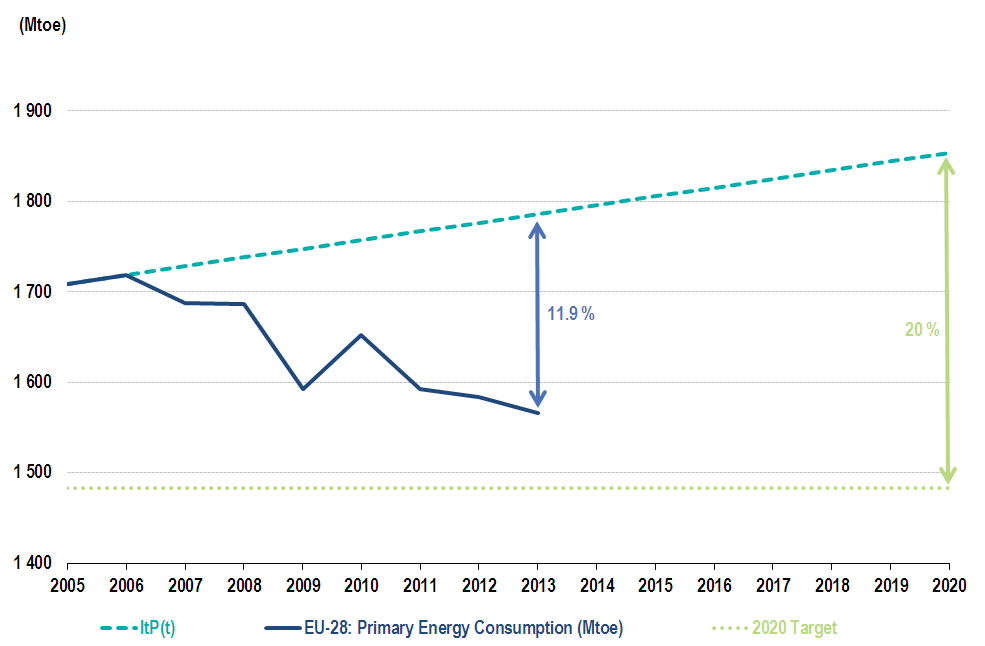
Total EU energy use and progress towards the EU’s 2020 energy efficiency target. Source: European Commission
EU energy mix
The sources of EU energy are changing too. EU energy from coal has fallen during most years between 1990 and 2013, reaching almost 40 per cent below 1990 levels (the far left bars in the chart below). Overall, oil use fell by 12 per cent over the same time period (second left, below).
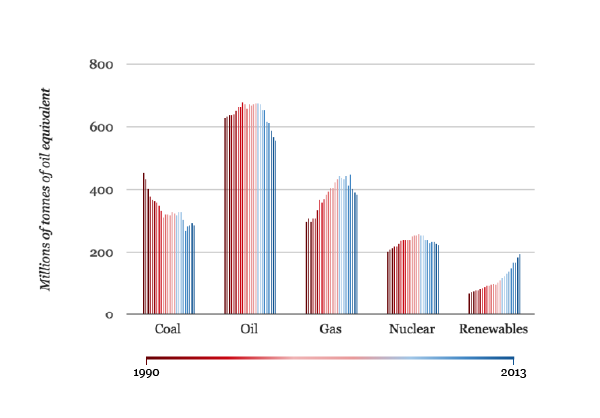
EU use of different energy sources between 1990 and 2013. Source: Eurostat; chart by Carbon Brief
The chart above also shows how oil, gas and nuclear energy use rose during the 1990s, before beginning to decline since around 2005. Renewables are the notable exception, with green energy use nearly tripling between 1990 and 2013 (far right bars in the chart above).
These shifting patterns of energy use mean coal’s share of the EU energy mix has dropped from 27 per cent in 1990 to 17 per cent in 2013, as the chart below shows. Conversely renewables’ share has tripled from four to 12 per cent over the same time period.

The share of different energy sources in gross EU energy consumption, 1990 (left) and 2013 (right). Source: Eurostat; chart by Carbon Brief
That means low-carbon energy sources now supply about a quarter of the EU’s energy. Put another way, fossil fuels still supply three quarters of the mix. This shows how far there is to go if the EU is to reach its longer-term ambition of cutting emissions by 80 per cent by 2050, against 1990 levels.
Member state energy mixes
Of course, each EU member state has a very different energy mix. This is often the underlying reason behind disagreements over EU climate and energy policy, such as those around the EU 2030 targets agreed last October.
For instance, some member states remain heavily dependent on coal for much of their energy. This has made them reluctant to sign up to ambitious climate targets or strong reforms of EU carbon markets, which would make energy from coal more expensive.
The maps below show country-by-country reliance on coal. The darker the shading, the heavier the country’s reliance on coal. There is a concentration of coal reliance in eastern Europe, with Poland the only EU state getting more than half of its energy from this source.
The UK, Germany and Greece all have above-average coal shares in their energy mixes. France and Spain have the lowest shares at around five per cent.
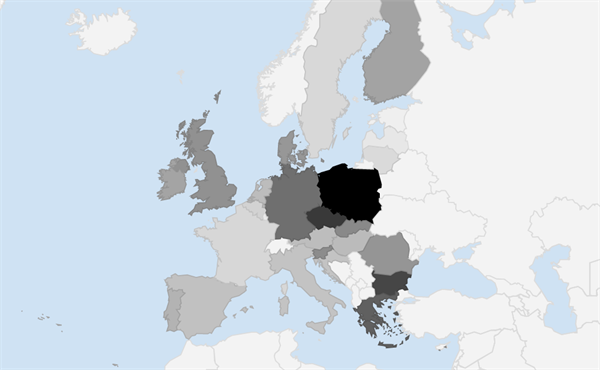
Coal as a share of the energy mix in EU member states. Darker colours represent a higher share for coal. The range runs from 54 per cent in Poland down to five per cent in France and Sweden. Source: Eurostat, map by Carbon Brief
You can see coal reliance alongside other energy sources for a selection of member states in the chart below. The EU average energy mix is shown for comparison, reflecting the 2013 pie chart shown above.
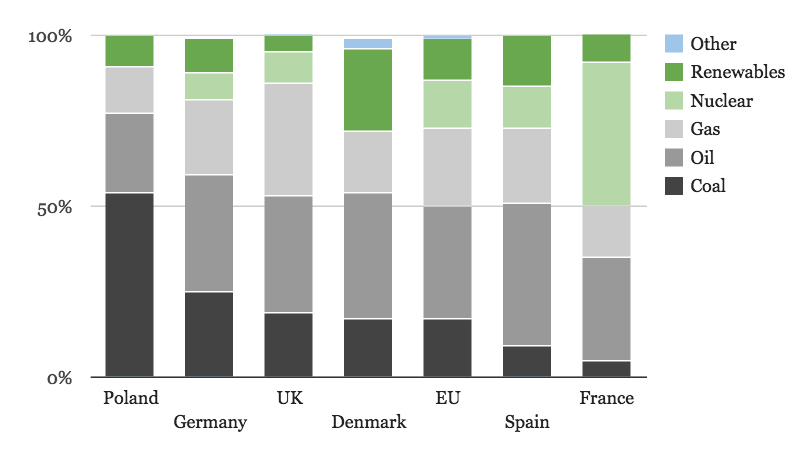
Share of different sources in the energy mix of selected EU countries, with the EU average shown for comparison. Source: Eurostat, chart by Carbon Brief.
France gets 42 per cent of its energy from nuclear (light green areas in the chart above), following its huge 1980s nuclear building programme. As a result it is far less reliant on coal.
The UK is dependent on gas than most other EU member states (light grey areas). It gets a third of its energy from this source, following the discovery of gas fields in the North sea and the 1990s dash for gas in the UK electricity sector. This might partly explain the UK government’s enthusiasm for shale gas, since North sea gas is in decline.
The UK is near the bottom of the league for renewable energy, which accounted for just five per cent of its energy in 2013 (dark green areas). That’s despite a rapid expansion of wind, solar and biomass in recent years.
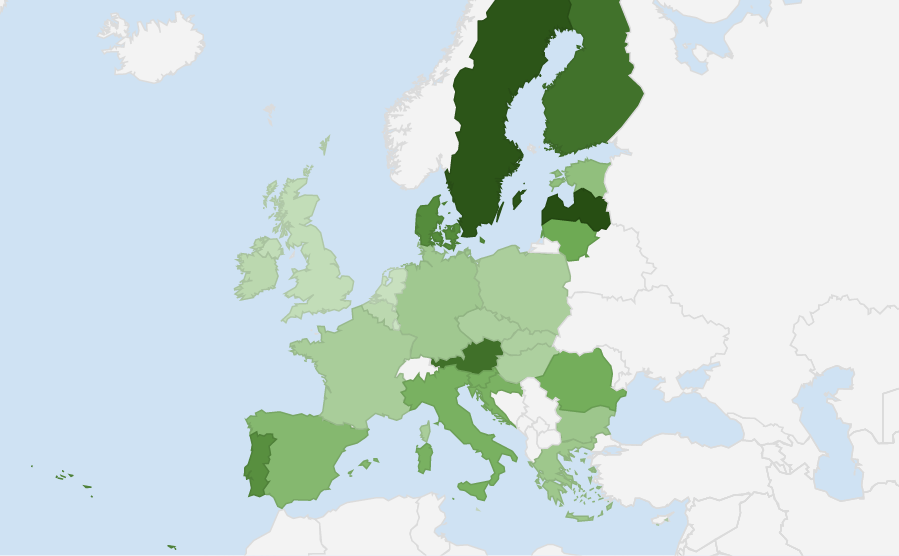
The map below shows country-by-country use of renewable energy. The highest shares of renewable energy are in states with plentiful hydro-power resources, such as Sweden, Finland and Austria.
Denmark, Spain and Portugal have relatively high renewable energy shares, driven by use of wind and solar. For all the talk of the German Energiewende and its pivot towards renewable energy, Germany was still only getting 10 per cent of its energy from renewables in 2013.
Renewables as a share of the energy mix in EU member states. Darker colours represent a higher share for renewables. The range runs from 36 per cent in Latvia down to five per cent in the UK, four in the Netherlands and Luxembourg and finally one per cent in Malta. Source: Eurostat, map by Carbon Brief
Germany’s renewables share is below the EU average of 12 per cent, while both are well short of the EU target of 20 per cent renewable energy by 2020. EU leaders have agreed that green energy’s share must more than double to 27 per cent in 2030.
Conclusion
The EU has seen its historic rise in energy use reversed through a combination of energy efficiency, structural changes in the economy and rising prices. Its use of fossil fuels is starting to fall, with coal use in particular down by two-fifths since 1990. And energy from renewables has tripled.
Yet in order to reach its long term climate goals, the EU will need to massively accelerate each of these trends.
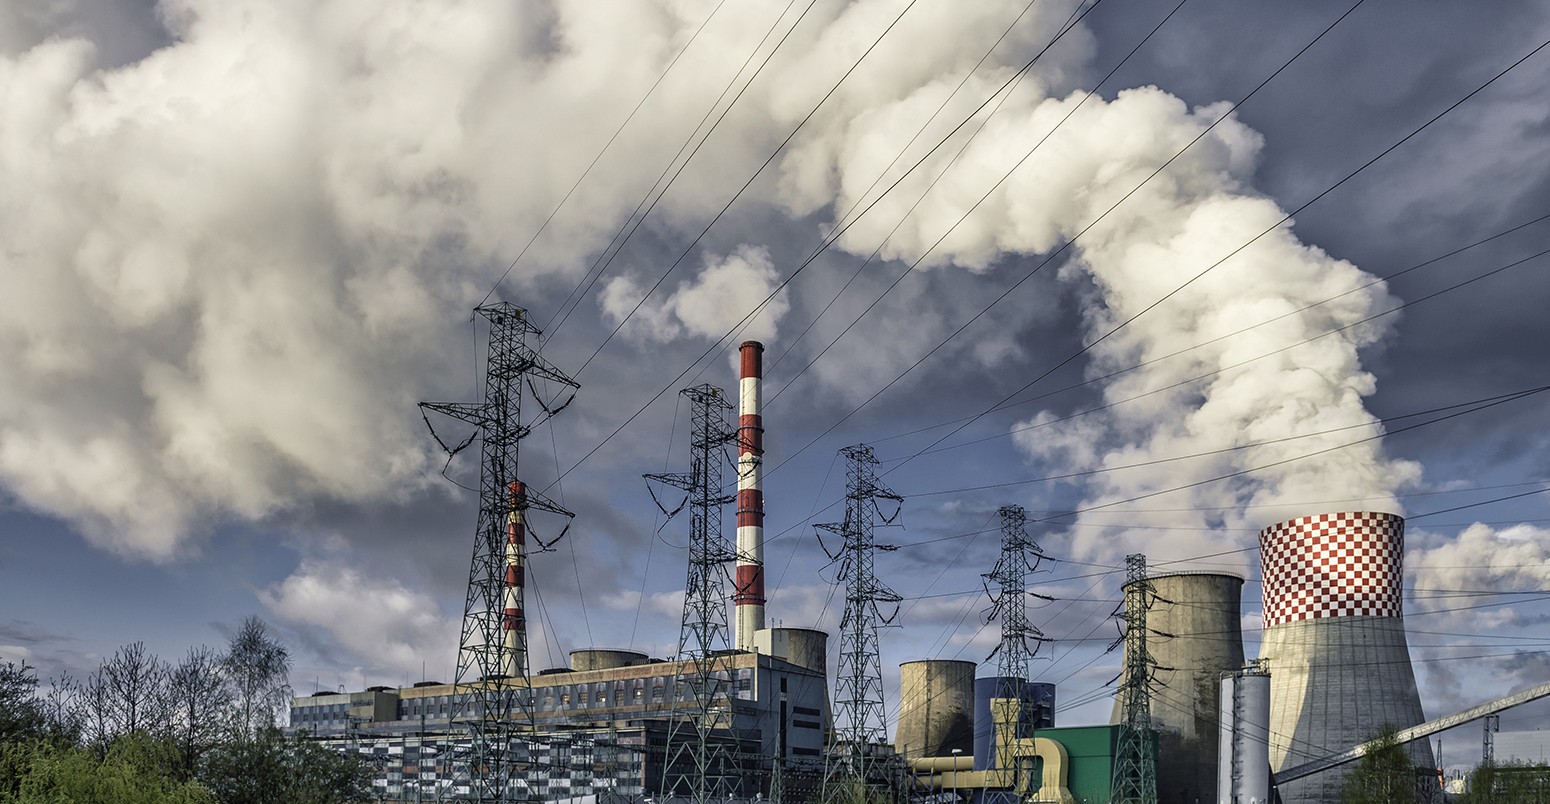
Main image: Polish coal plant.
Update 14:00: The article was corrected. The previous version said Estonia got 66 per cent of its energy from coal. In fact, this energy comes from oil shale rather than coal. Oil shale is an unusual fossil fuel mainly found in Estonia and Utah. Eurostat lists it along with coal under the heading "solid fuels", hence the error. Oil shale is dirtier than coal in emissions terms.