I’m a professor of space environment physics and a director of research at the University of Reading in the UK. My particular topic of research is the sun, how it changes over time and how those changes affect the space environment, the weather and the climate on Earth.
In the last few years, my work has focused on how temperatures in the northern hemisphere have responded to periods in history when the sun has been very quiet. The “activity” of the sun’s magnetic field is related to the number of sunspots that appear on its surface.
The sun’s activity rises and falls on an approximately 11-year cycle, but also varies on century-long timescales. It’s this research I talked to BBC weatherman Paul Hudson about in an interview for the BBC’s Inside Out programme.
Unfortunately, I now find myself in the position of being cited as predicting that the current rapid decline in solar activity will plunge the world into a “Little Ice Age”.
This is very disappointing as it is not at all supported by the science.
Weather and climate are inherently complicated – and uncovering and attributing past changes is very difficult. So it’s worth being clear about the state of the science, as well as some of the myths, misconceptions and misnomers that abound in this area.
The “Little Ice Age” wasn’t really an ice age
Let us start with the term “Little Ice Age”. I personally dislike it and avoid using it, as I don’t think it was an ice age at all.
There is some evidence for a prolonged period of somewhat lower global mean temperatures beginning in around 1400 to 1500 (estimates vary) and ending sometime between 1700 and 1800.
This has been termed the “ Little Ice Age” and is often wrongly linked with the Maunder minimum in solar activity, a period between about 1650 and 1700 when almost no sunspots were seen.
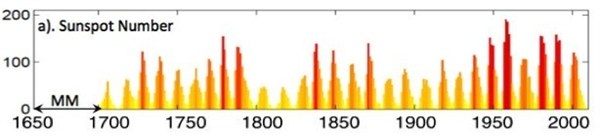 Annual averages of sunspot numbers since 1650. The Maunder minimum is marked MM. Source: Lockwood et al., ( 2011)
Indeed, some reports even use the terms “Maunder minimum” and “Little Ice Age” interchangeably. But the period known as the “Little Ice Age” began a long time before the start of the Maunder minimum, and continued long after it ended.
There is very little evidence that the lower global mean temperatures between 1400 and 1800 were caused by solar activity – there’s more evidence it was associated with volcanic activity and/or internal oscillations in the climate system.
During the Maunder minimum there were an unusually large number of cold winters in Europe. However, there is no evidence that this was a global phenomenon. Indeed, our research strongly suggests it was a regional phenomenon and that the colder winters in Europe would have been accompanied by warmer ones elsewhere, for example Greenland.
Calling this period of more frequent cold European winters a “Little Ice Age” or a “mini Ice Age” is hugely misleading as it implies Europe experienced unremitting cold throughout the Maunder minimum. This is completely wrong. A good example of why comes from the Central England Temperature (CET) record, which extends continuously back to 1659.
If we take the winter averages (December, January and February) we find the coldest winter on record was 1683/4 – right in the middle of the solar Maunder minimum. However just two years later, and still right in the middle of the Maunder minimum, we have the sixth warmest winter in the whole 353-year CET record.
What’s more, there’s no evidence that summers in the Maunder minimum were any colder than usual. This is not a “Little Ice Age” – it is not an ice age of any shape or form.
Evidence is growing for a regional effect of low solar activity
Much of what has been written in the media and on the internet fails to appreciate the difference between regional and global climates. My research looks at a potential link between low solar activity and cold European winters. That’s a regional and seasonal effect and not a global effect.
Statistically, we found a significant link between the occurrence of cold winters in the long CET record and solar activity. By “significant” we mean that there was only a five per cent chance that we were being fooled by a coincidence.
Using methods like numerical modelling, we’re getting a better understanding of what could be driving the relationship. The likely mechanism is that changes in solar ultraviolet output alters the temperature distribution and winds in the stratosphere in winter and this, in turn, disrupts the northern-hemisphere jet stream, causing more frequent “blocking” events.
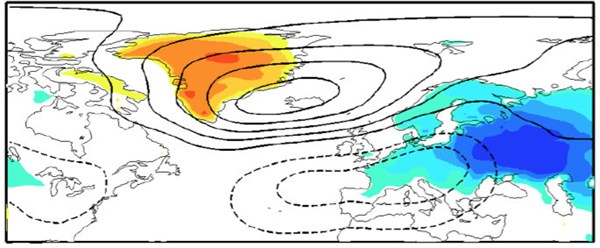
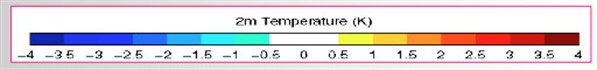
Analysis of the effect of low solar activity on winter surface temperatures via blocking events for 1976-2010. Blue areas are colder than average, orange are warmer. Source: Lockwood et al., ( 2010)
This potential mechanism is still a matter of vibrant debate in the academic community because it is difficult to understand how the very thin atmosphere in the stratosphere can influence the much denser troposphere below, where our weather and climate resides.
Another Maunder minimum would have a very small effect globally
What is most interesting for me is the current decline in solar activity. The “exceptional” low minimum in the 11-year solar cycle seen in 2008/9, and the subsequent weakness of the current solar cycle, are both part of a steady decline that has been going on since about 1985. This has returned the sun to conditions last seen around 1910.
If we compare this to records of solar activity derived from isotopes stored in tree trunks and ice sheets we find this decline is faster than any in the last 9,000 years, increasing the probability that the sun will return to Maunder minimum conditions within about 50 years.
So what do we think the effect of a return to Maunder minimum conditions on global mean temperatures would be? The answer is very little.
In a paper with scientists from the Met Office’s Hadley Centre, we used an energy balance model to show the slowing in anthropogenic global warming associated with decline in solar irradiance to Maunder minimum levels.
We found the likely reduction in warming by 2100 would be between 0.06 and 0.1 degrees Celsius, a very small fraction of the warming we’re due to experience as a result of human activity. Other scientists such as Georg Feulner and Stefan Rahmstorf from Potsdam, Germany had reached very similar conclusions.
I’ve also used observations from the last 50 years to investigate the effect of solar activity on global temperatures – and like several other authors, I find only a very minor effect.
You can see this in the graph below from the recently released IPCC report. The top panel is global temperature since 1890 and the other panels show how different factors have contributed to the changes we’ve seen. The pink lines are taken from my research.
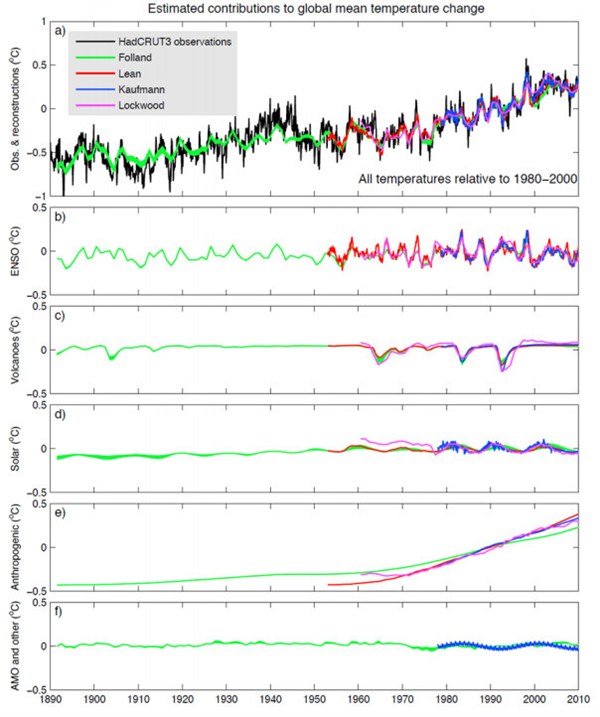
Source: Intergovernmental Panel on Climate Change (IPCC) 5th Assessment Report ( AR5) Chp 10, Figure 10.5 (p10-114).
In the fourth panel, you can see solar activity has had negligible long-term effect. Compare that to anthropogenic (human-caused) emissions in the next panel down.
The decline in solar activity right now is incredibly interesting. It can tell us a great deal about how solar variability arises and it is giving us new insights as to what the sun during the Maunder minimum was really like.
Our research tells us very clearly that this decline has only very small implications for global climate, but it does also indicate that Europe may have to get used to a higher frequency of colder winters. These conclusions in no way contradict each other and I think they are both interesting and important.