
State of the climate: Strong El Niño puts 2026 on track for second-warmest year
Zeke Hausfather
04.21.26Zeke Hausfather
21.04.2026 | 2:11pmThe first three months of 2026 have been the fourth warmest on record, with each successive month surpassing historical averages by a greater margin.
While weak La Niña conditions pushed down temperatures at the start of the year, scientists expect the development of a strong – and potentially “super” – El Niño event by early autumn.
El Niño and La Niña are the warm and cool phases of the El Niño-Southern Oscillation (ENSO), a recurring climate pattern in the tropical Pacific that shapes global weather patterns.
Based on temperature datasets from five different research groups, Carbon Brief predicts that 2026 is likely to be the second-warmest year on record.
The year is virtually certain to be one of the four warmest on record and, currently, has a 19% chance of surpassing 2024 as the warmest year on record.
However, the development of a strong El Niño event later this year would substantially increase the chance that 2027 will be the warmest year on record.
In addition to near-record warmth, the start of 2026 has seen record-low sea ice cover in the Arctic, with the year tying with 2025 for the lowest winter peak in the satellite record.
Fourth-warmest start to the year
In this latest quarterly state of the climate assessment, Carbon Brief analyses records from five different research groups that report global surface temperature records: NASA, NOAA, Met Office Hadley Centre/UEA, Berkeley Earth and Copernicus/ECMWF.
The figure below shows the annual temperatures from each of these groups since 1970, along with the average over the first three months of 2026.
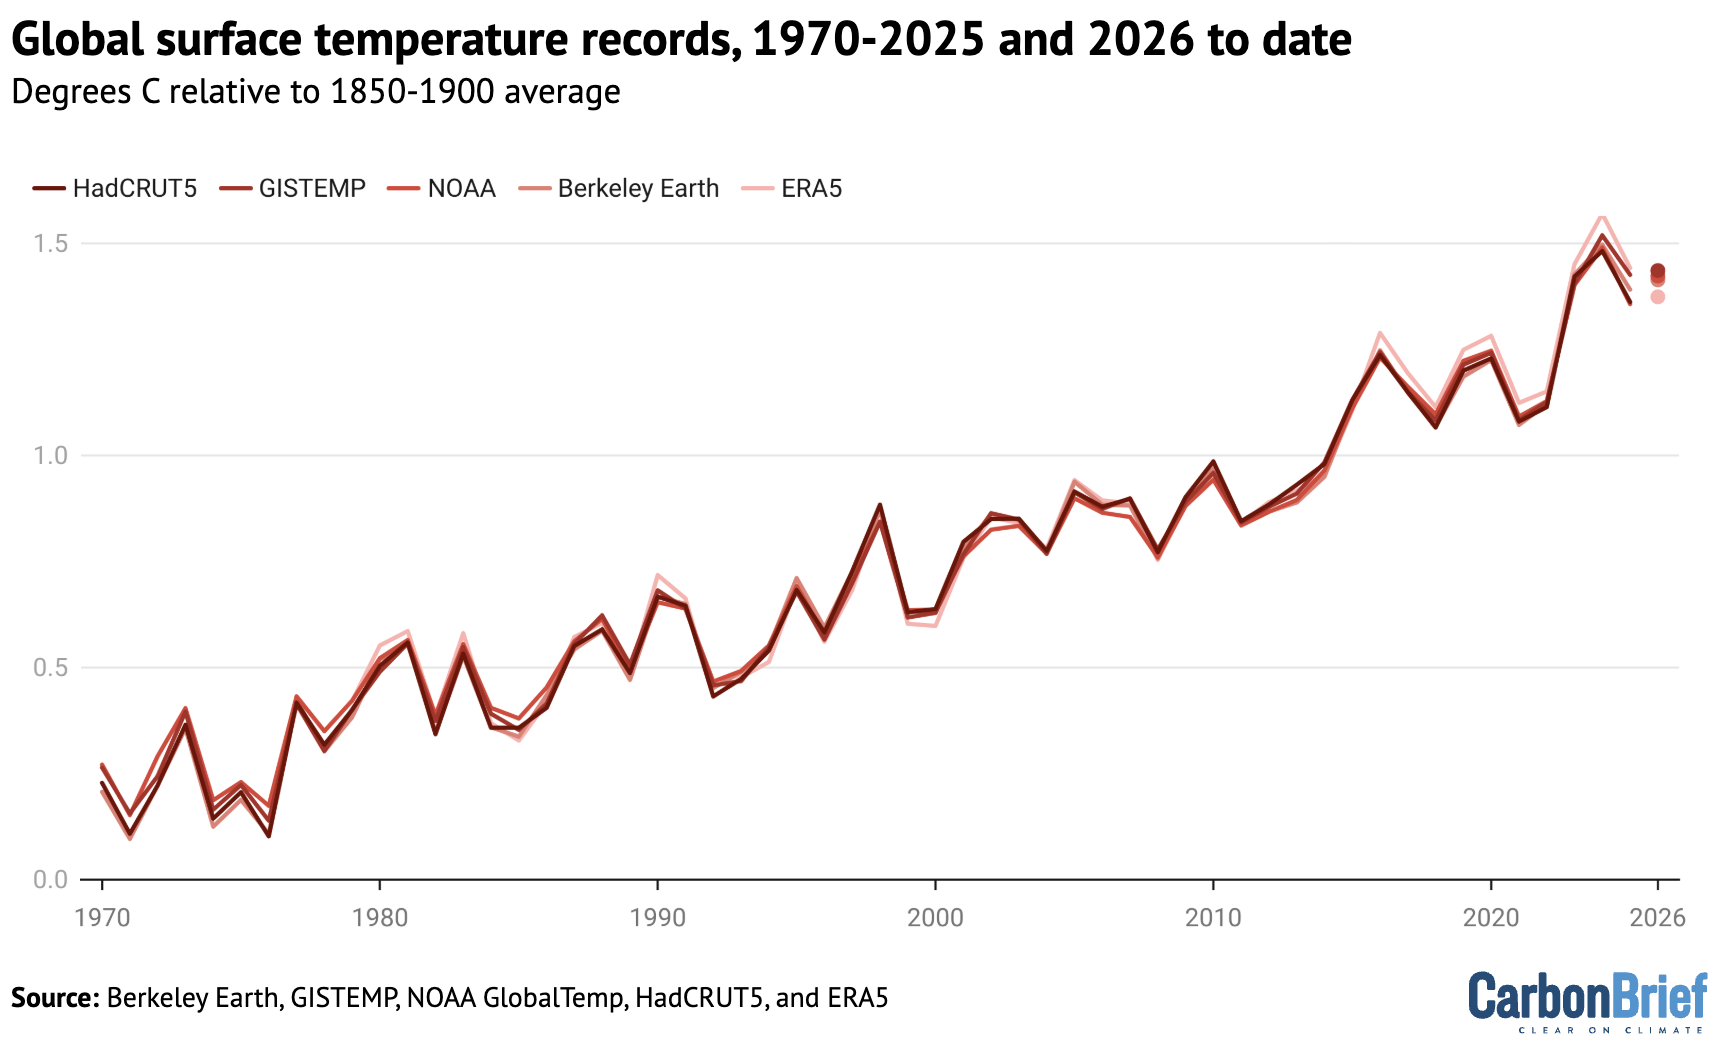
(It is worth noting that warming in the first three months may not be representative of the year as a whole, as temperatures relative to pre-industrial levels tend to be larger in the northern hemispheric winter months of December, January and February.)
Carbon Brief provides a best estimate of global temperatures by averaging the different records using a common 1981-2010 baseline period and then adding in the average warming since the pre-industrial period (1850-1900) across the datasets – NOAA, Hadley and Berkeley – that extend back to 1850. (This follows the approach taken by the World Meteorological Organization in its state of the climate reports.)
The figure below shows how global temperature so far in 2026 (black line) compares to each month in different years since 1940 (lines coloured by the decade in which they occurred).
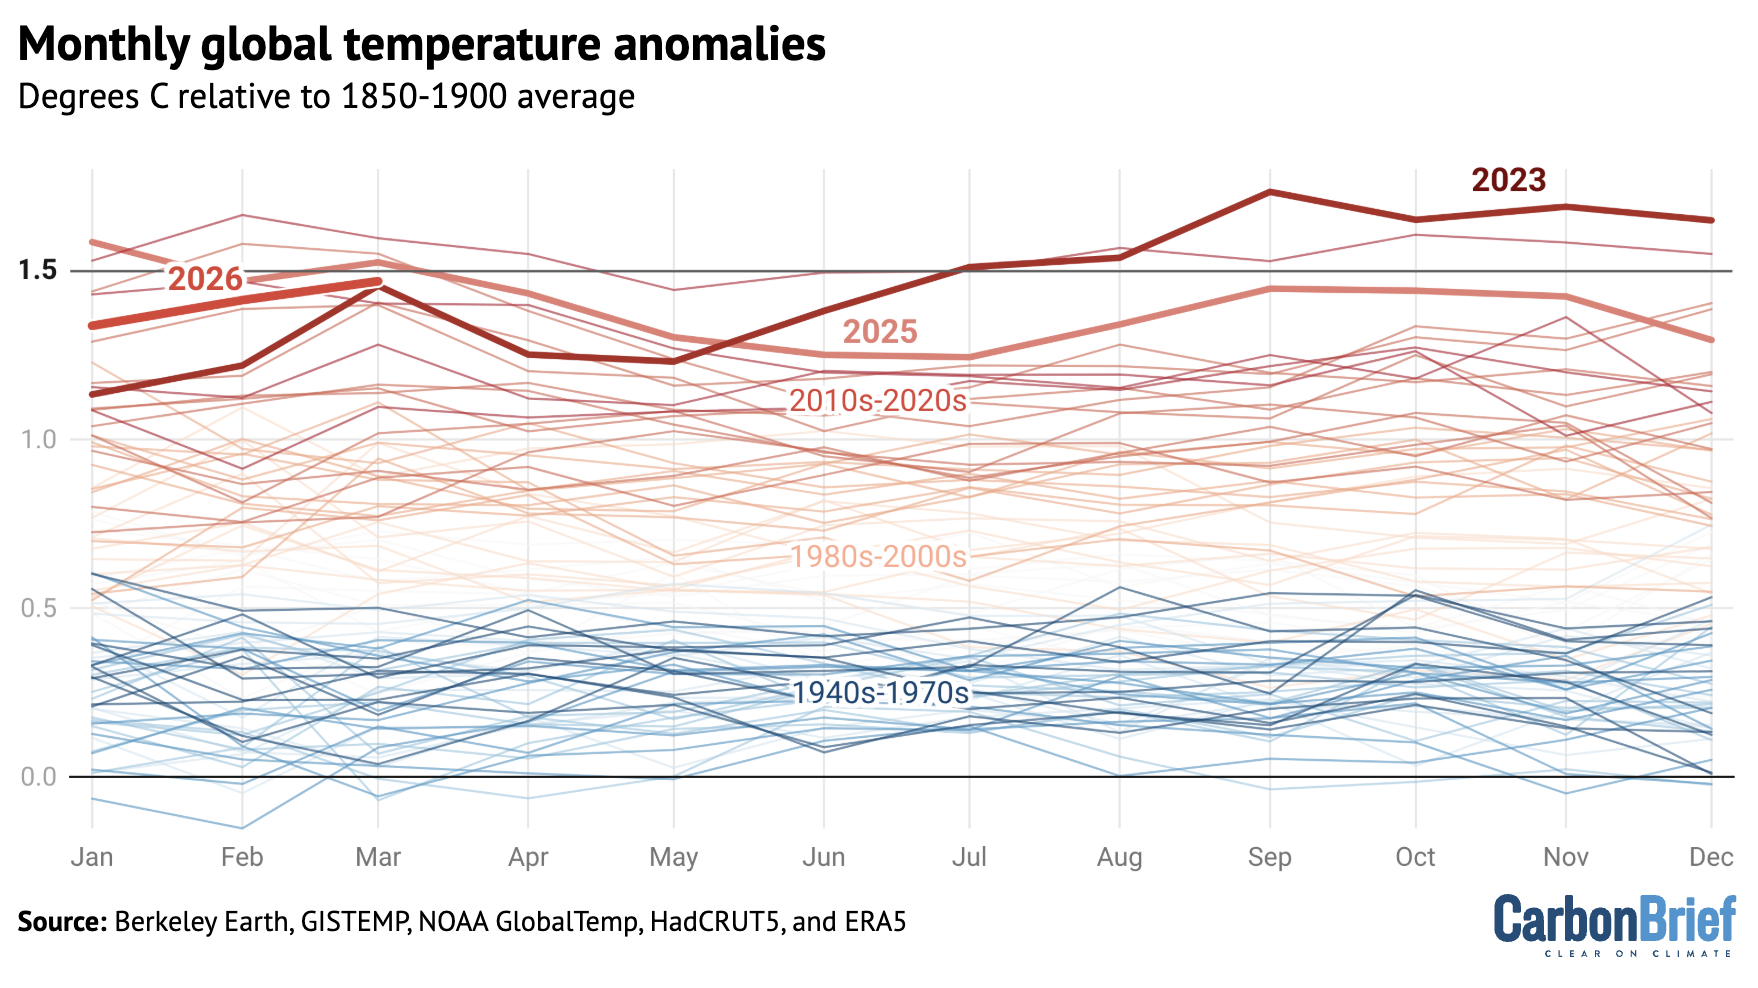
The first three months of 2026 have been relatively warm, coming in in the top-five warmest on record across all the different scientific groups that report on global surface temperatures. This is despite the presence of weak La Niña conditions in the tropical Pacific at the start of the year, which typically suppress global temperatures.
January 2026 was the fourth- or fifth-warmest January on record across all the groups, February was the fourth- to sixth-warmest and March was between the second and fourth warmest.
| Dataset | January | February | March |
|---|---|---|---|
| HadCRUT5 | 5th | 6th | Yet To Report |
| NOAA | 5th | 5th | 2nd |
| GISTEMP | 5th | 4th | 4th |
| Berkeley Earth | 4th | 4th | 4th |
| Copernicus ERA5 | 5th | 5th | 4th |
Global temperature anomalies have been steadily increasing since their low point in January, as La Niña conditions have faded.
When combined, the first three months of the year in 2026 were the fourth-warmest in the historical record, below only 2024, 2025 and 2016.
A potential ‘super’ El Niño
There is reason to expect that global temperatures will continue to increase over the remainder of the year, as a strong – or even “super” – El Niño event is expected to develop later in the year.
Since the start of April, 13 different modelling groups have published estimates of future El Niño strength through at least September. These, in turn, contain 637 different model runs, as each model is run multiple times to better characterise the range of potential El Niño development.
There are a number of different ways to assess the strength of an El Niño or La Niña event.
The most common is the temperature anomaly in the “Niño3.4” region of the tropical Pacific. In addition, these temperatures have the human warming signal removed from changes over time in that part of the Pacific.
There are other approaches to assessing the strength of El Niño, including the newly released relative Oceanic Niño Index (RONI), which may be more accurate. However, RONI data is not readily available from all models today.
The figure below shows a distribution of Niño3.4 temperature anomalies across all of the runs of all of the models (top panel), as well as the range of runs across each of the individual models (bottom panel). Sustained sea surface temperatures in excess of 0.5C indicate an El Niño event, temperatures above 1.5C represent a strong El Niño event and above 2C is often referred to as a “super” El Niño event.

The latest climate models give a central (median) estimate of 2.2C warming by September – a scenario which would put the world firmly in “super” El Niño territory.
Warming would likely strengthen after September, as El Niño conditions generally peak between November and January.
However, there is still a wide spread among models, with some, such as CanESM5 and DWD, only showing a weak-to-moderate El Niño.
Historically, it has been hard to accurately forecast the development of El Niño during early spring, so it will be a few more months before scientists can be confident that a strong or super El Niño will develop.
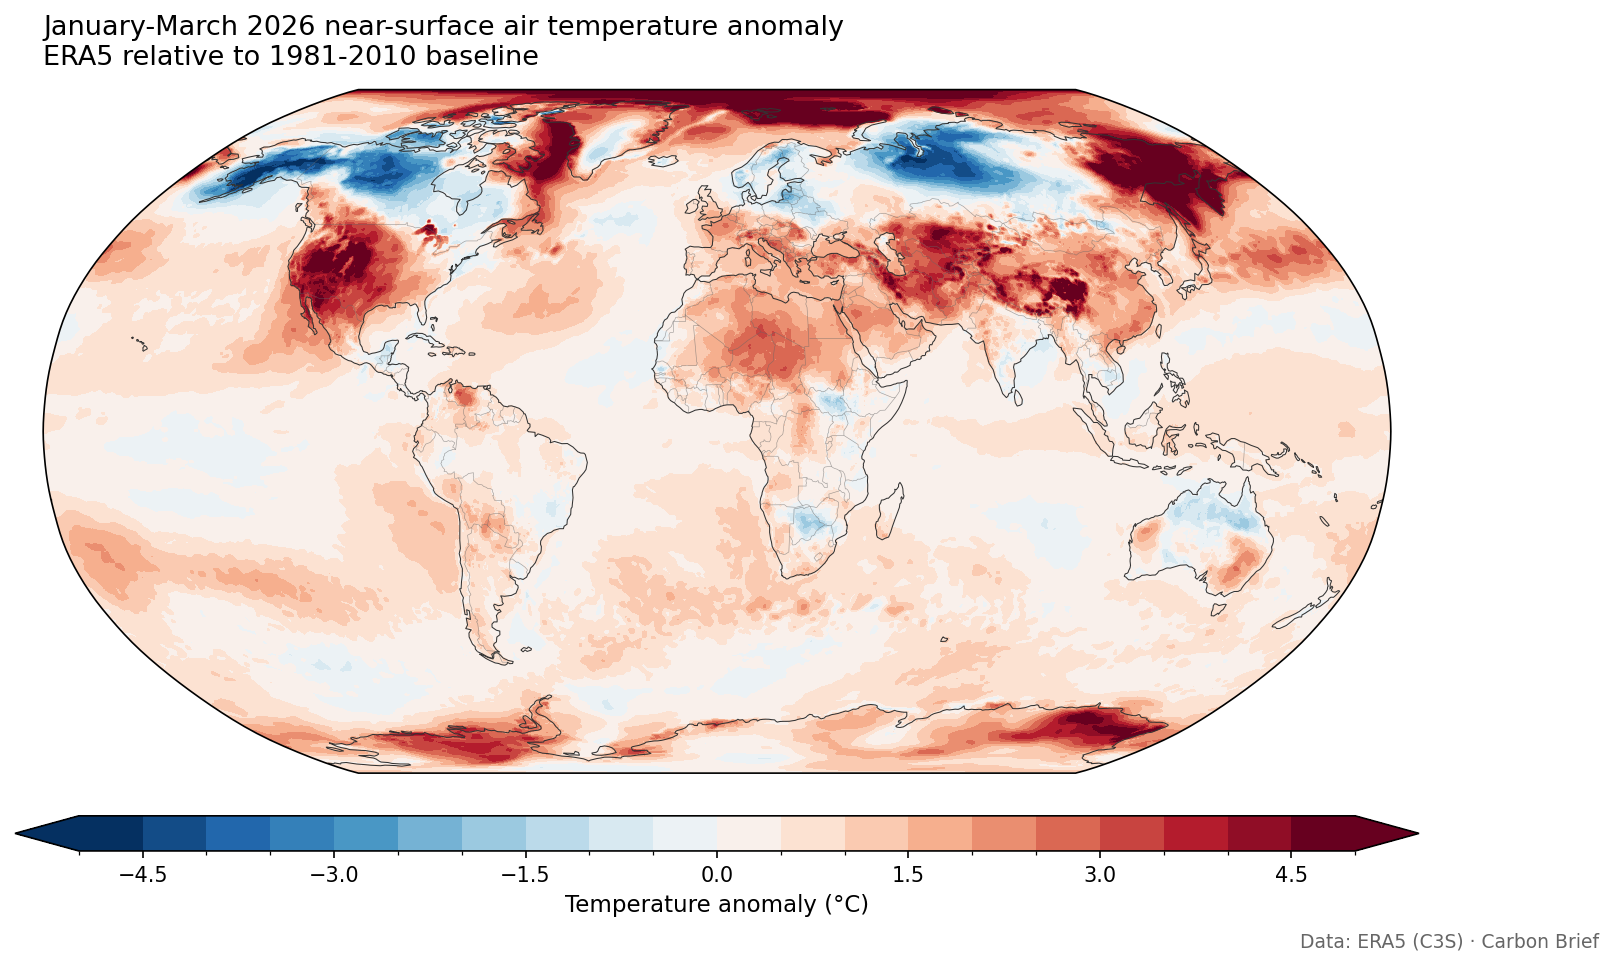
Exceptional regional warmth
There were many regions of the planet that saw exceptional warmth in the first quarter of 2026. This includes much of the western US, western China and eastern Russia.
The figure below shows the temperature anomaly in the ERA5 dataset, relative to a more recent 1981-2010 baseline period. (ERA5 does not provide gridded data back to the pre-industrial era.)
In addition to temperature anomalies, it is useful to look at where new records have been set. The figure below shows each grid cell that saw one of the top-five warmest first-quarter periods on record, as well as the top-five coolest.
During the first quarter of 2026, 5.2% of the globe saw record warm temperatures, while virtually no place on earth had record cool temperatures. In addition, 24.3% of the globe was in the top-five warmest on record, whereas only 0.1% was in the bottom-five coolest on record.
On track to be second-warmest year on record
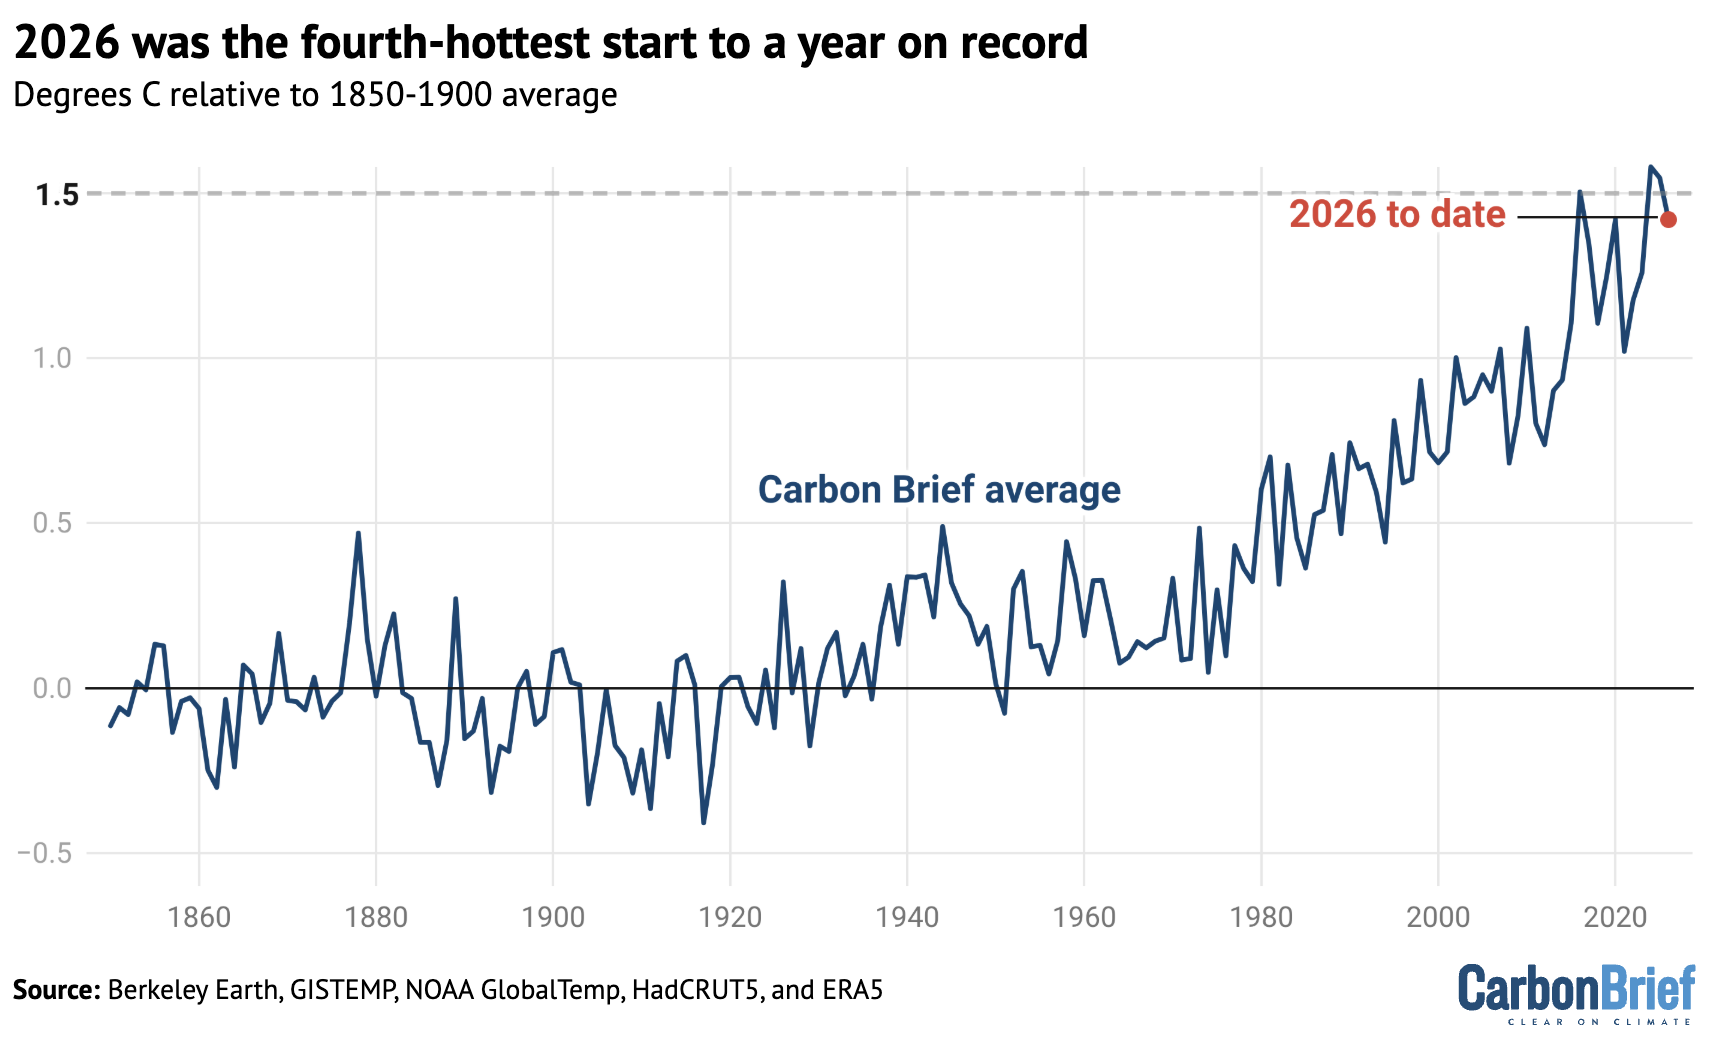
Carbon Brief estimates that the global average temperature in 2026 will be between 1.37C and 1.58C above pre-industrial levels, with a best estimate 1.47C. This puts 2026 on track to likely be the second warmest year on record, though it could potentially be as high as the warmest or as low as the fourth warmest.
This is based on the relationship between the first three months and the annual temperatures for every year since 1970. The estimate also accounts for El Niño and La Niña conditions seen in the first three months of 2026, as well as how El Niño conditions are projected to develop across the rest of the year.
The analysis includes a wide range of possible outcomes in 2026, given that temperatures from only the first quarter of the year are available so far.
The chart below shows the expected range of 2026 temperatures using the Carbon Brief average of groups – including a best-estimate (red) and year-to-date value (yellow). Temperatures are shown with respect to the pre-industrial baseline period (1850-1900).
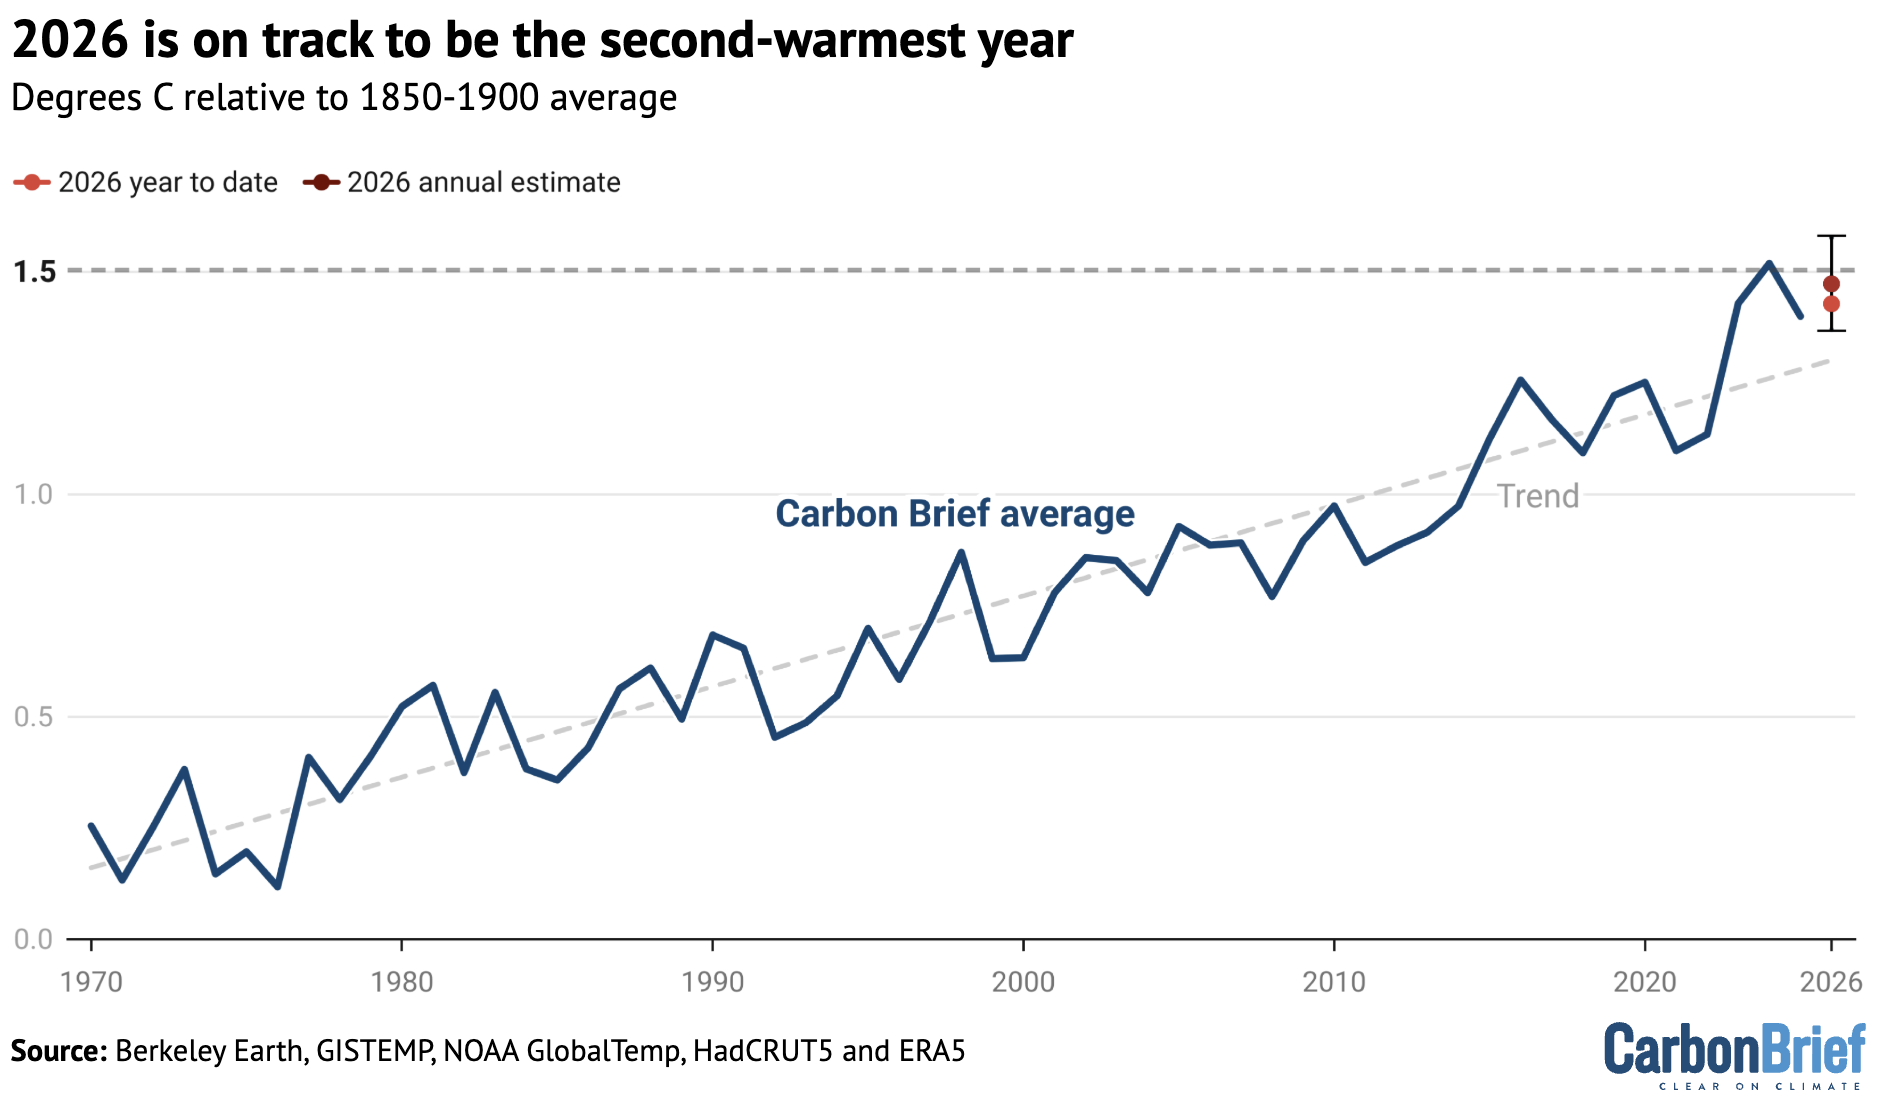
Carbon Brief’s projection suggests that 2026 is virtually certain to be one of the top-four warmest years, with a best-estimate – a 62% chance – that it ends up between 2024 and 2023 as the second-warmest year on record.
However, there remains a 19% chance that 2026 will be the warmest year on record – beating the prior record set in 2024. There is also a 19% chance that it will end up as the third- or fourth-warmest year.
The chances of a record-breaking year depends on the strength of El Niño, as well as how rapidly global temperatures warm up as El Niño develops.
There is also a roughly 30% chance that 2026 will be the second year that exceeds 1.5C above pre-industrial levels.
While the development of a strong or “super” El Niño will give a boost to 2026 temperatures in the latter part of the year, its largest effects will likely be felt in 2027.
Historically, the year where El Niño develops has been warmer than usual, but the year that follows the phenomenon’s winter peak – for example, in 1998, 2016 and 2024 – is record-setting.
This is because there is an approximately three-month lag between the peak of El Niño conditions in the tropical Pacific and the maximum global surface temperature response. If a super El Niño develops this year, it is likely that 2027 will set a new record.
Record-low winter Arctic sea ice
Earlier this year, Arctic sea ice saw the joint-smallest winter peak in a satellite record going back almost half a century.
Sea ice extent peaked for 2026 at 14.29m square kilometres (km2) on 15 March, marking a “statistical tie” with a record low recorded the year before, according to the US National Snow and Ice Data Center (NSIDC).
The figure below shows both Arctic and Antarctic sea ice extent in 2026 (solid red and blue lines), the historical range in the record between 1979 and 2010 (shaded areas) and the record lows (dotted black line).
(Unlike global temperature records, which only report monthly averages, sea ice data is collected and updated on a daily basis, allowing sea ice extent to be viewed up to the present.)
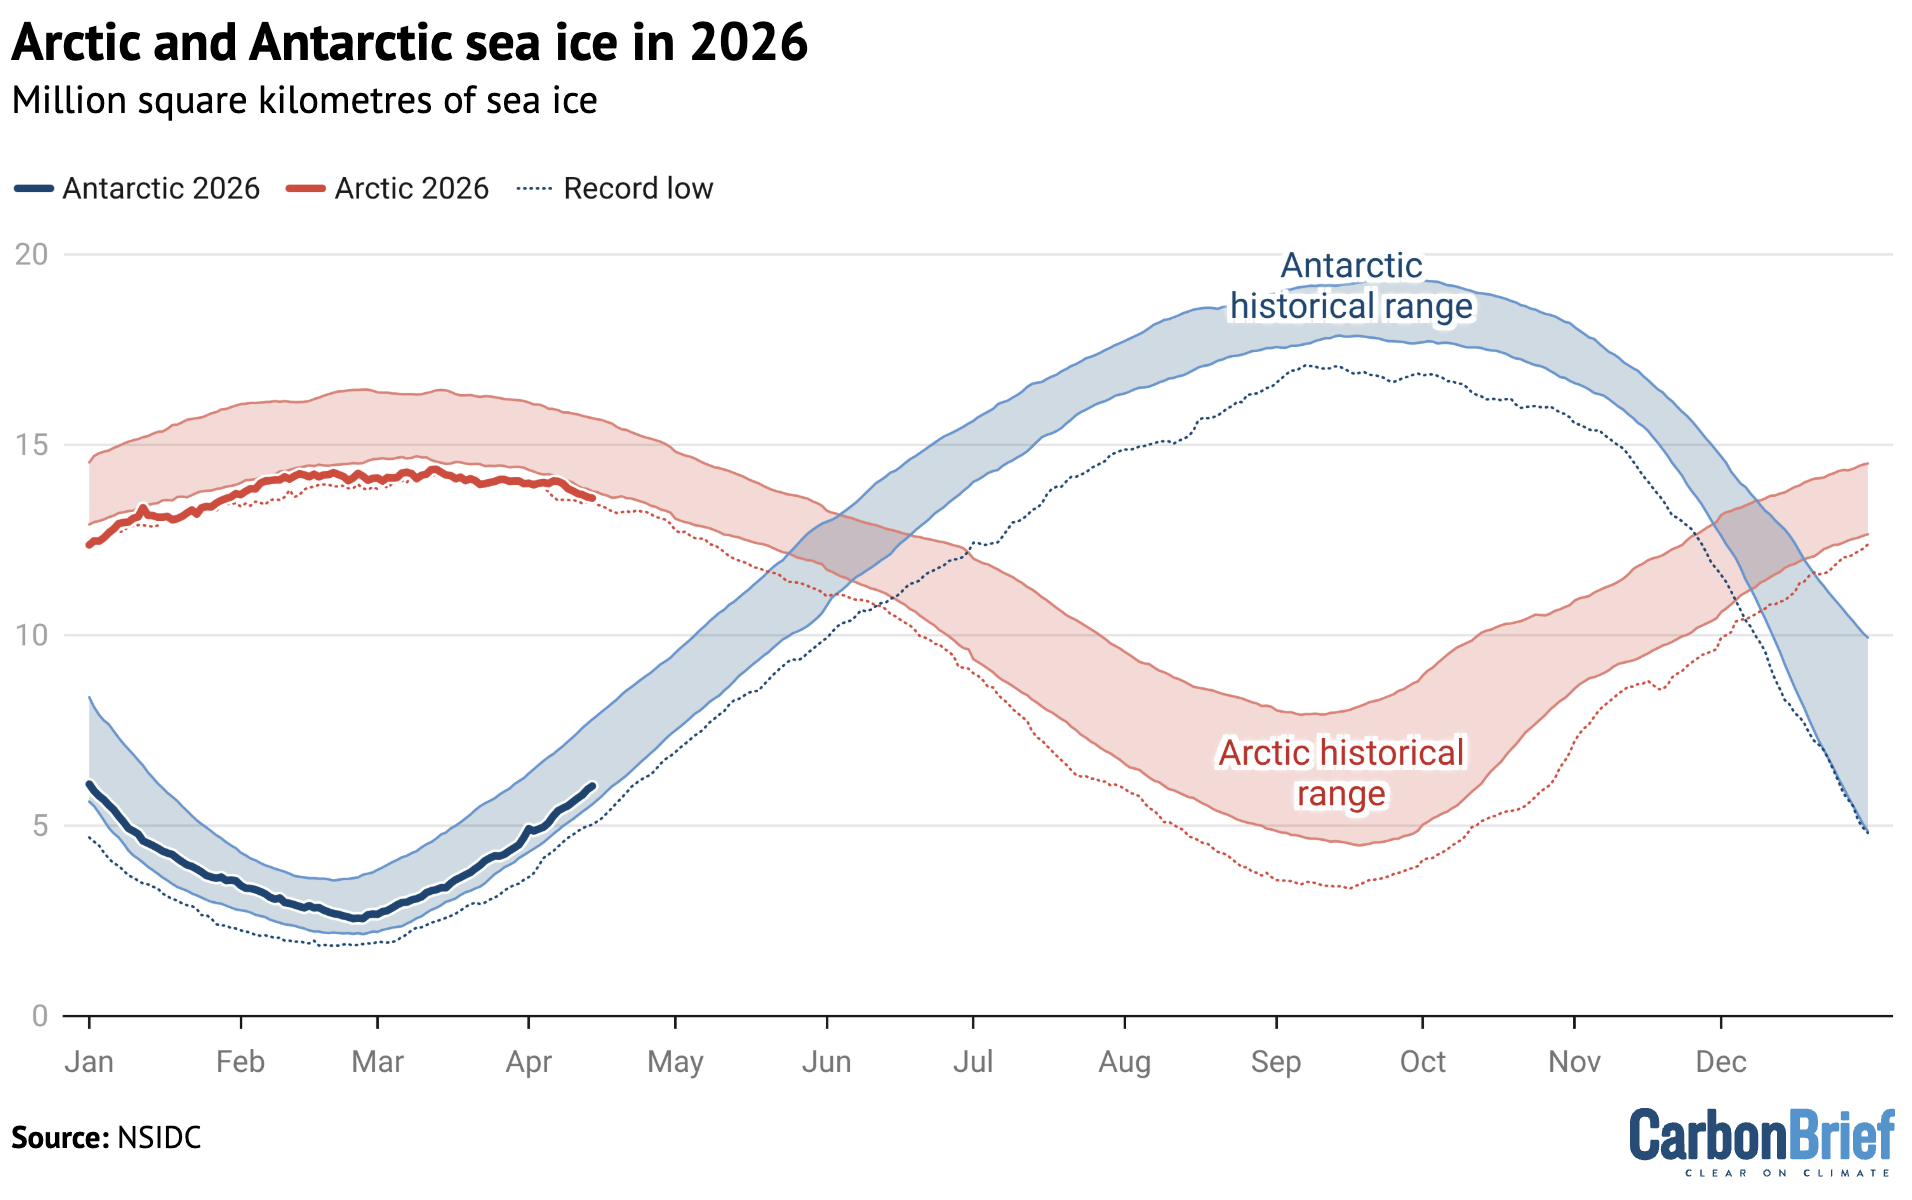
Arctic sea ice set new record daily low values during periods of January, March and early April. Antarctic sea ice did not set any new records so far in 2026, but remains on the low end of the historical (1979-2010) range.