Tackling gender inequality is ‘crucial’ for climate adaptation
Ayesha Tandon
12.15.20Ayesha Tandon
15.12.2020 | 10:00amEfforts to tackle gender inequality can play a key role in how countries adapt to the growing risks posed by climate change, a new study says.
There is a growing body of evidence showing that women are generally more vulnerable to the negative impacts of climate change than their male counterparts.
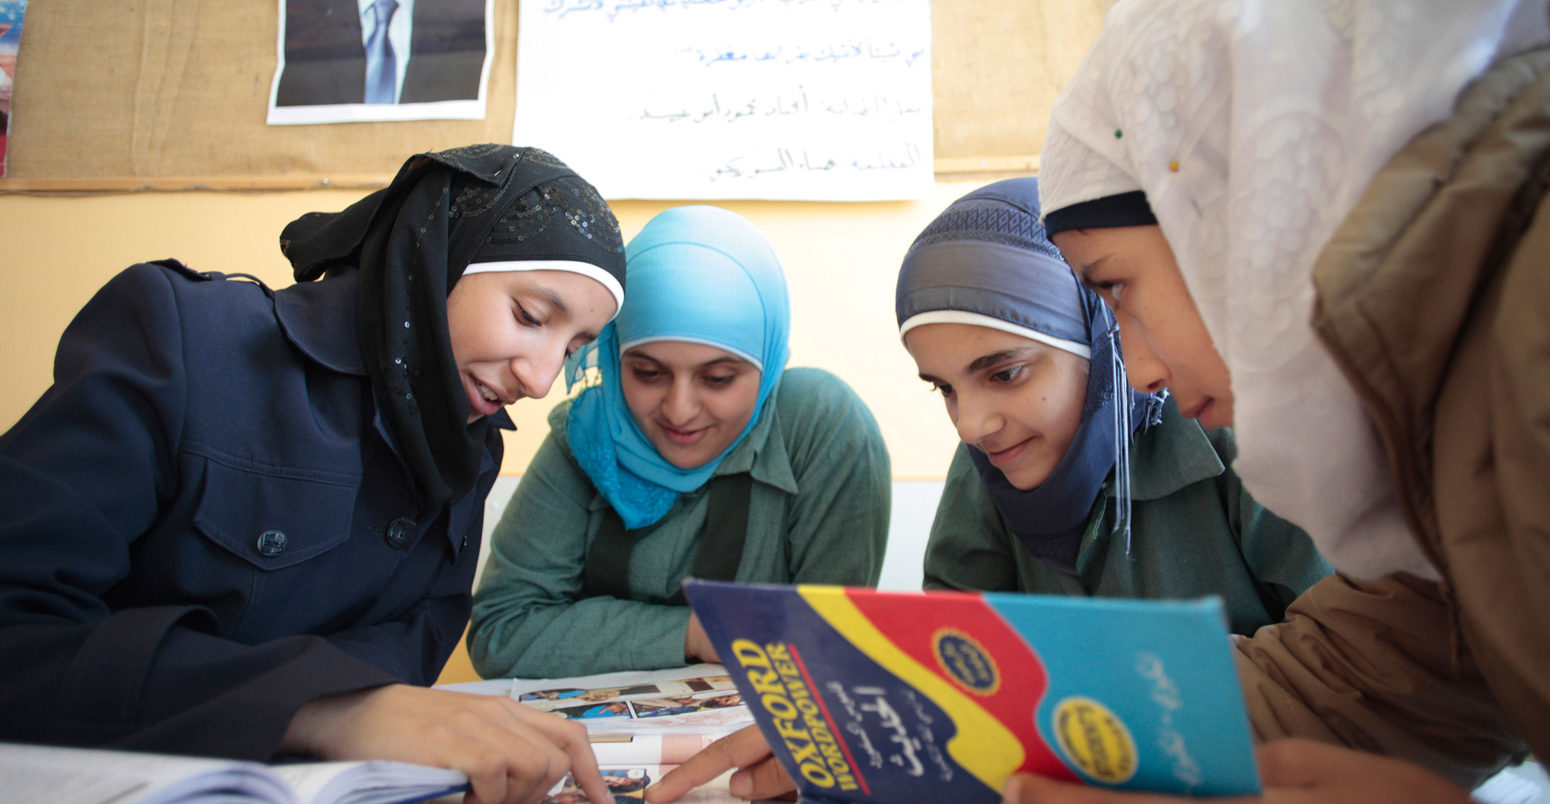
Now new research, published in Nature Communications, shows that empowering women through improved healthcare, education, and representation in government could help societies adapt more quickly and easily to the impacts of a changing climate.
At present, more than 70% of girls experience high levels of gender inequality – predominantly in developing countries – the study says. However, it finds that if society can follow a pathway of sustainable development in the coming decades, progress towards achieving gender equality could see this number could drop below 25% by 2030.
Role of women in climate adaptation
A country’s vulnerability to the impacts of climate change depends largely on how quickly and easily it can adapt to changes. For example, a country that can quickly build defences to protect against rising sea levels may be less vulnerable to the negative impacts of flooding than a country that cannot.
Countries in which people, institutions, and systems can respond quickly to the impacts of climate change are said to have a high “adaptive capacity”. Developed countries often have higher adaptive capacities than developing nations – in part because they have more wealth to invest in adaptive measures.
However, there are also a range of factors – including income, occupation and education – that can affect a person’s vulnerability to the impacts of climate change. In many countries, women are particularly disadvantaged by these factors due to entrenched social norms and socio-economic structures. (Carbon Brief recently explored the published literature on this topic.)
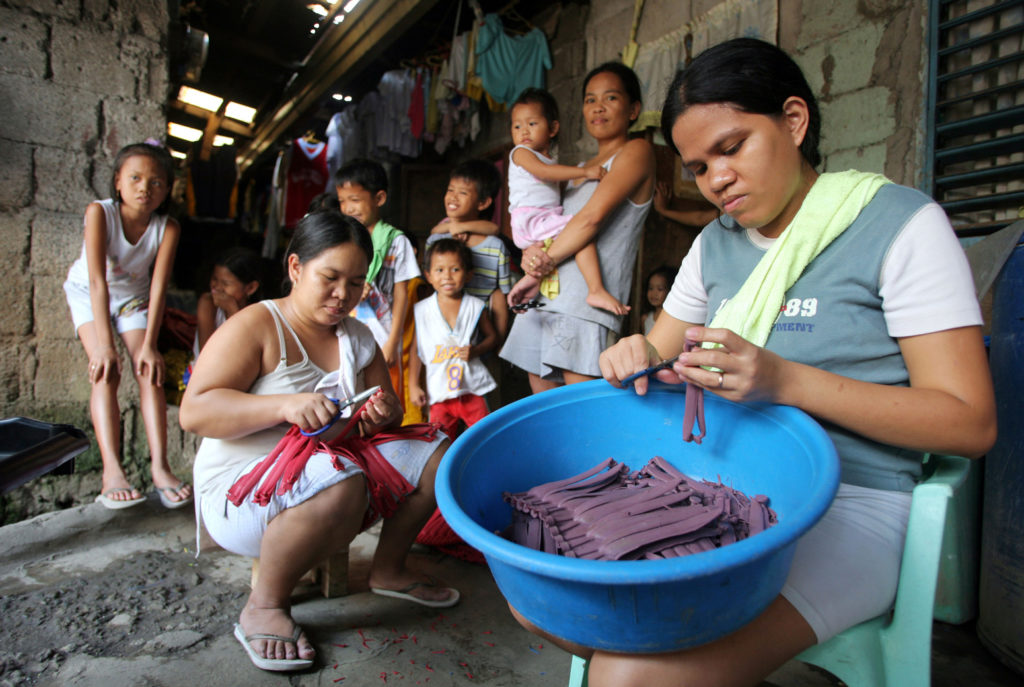
As a result, women are often more vulnerable to the impacts of climate change, explains Marina Andrijevic, a research analyst at Climate Analytics and the lead author of the study. She tells Carbon Brief:
“There’s a solid base of evidence showing that women are disproportionately vulnerable to climate change, not because there is something inherently vulnerable about women, but because of socio-cultural structures that deprive women of access to resources, decision-making, information, agency, etc.”
Andrijevic has also found through her work that the least gender-equal societies are often the most vulnerable to climate change.
The plots below show the relationship between gender inequality to climate vulnerability (left) and climate action (right). In these plots, each dot represents an individual country, with the red and blue lines showing the trends. A higher gender inequality number indicates a higher level of inequality between men and women.
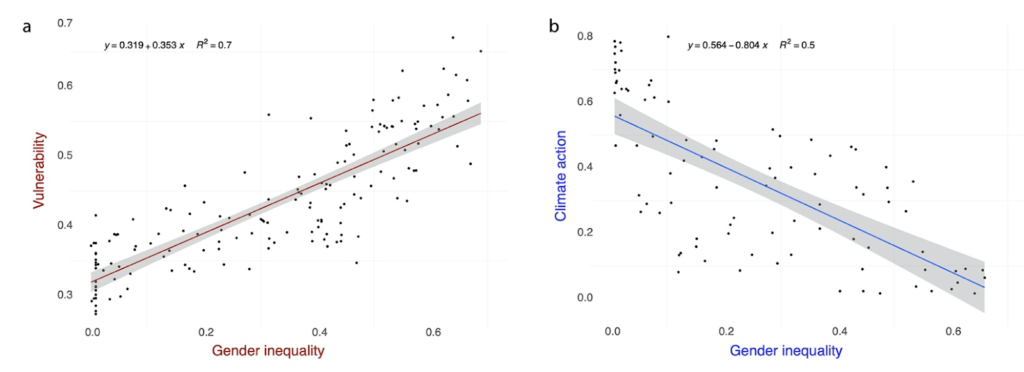
The plot on the left shows that countries with a high level of gender inequality generally have a higher vulnerability to the negative impacts of climate change. Climate vulnerability is measured using an indicator that combines a range of factors – including food, water and health.
The plot on the right shows that countries with high levels of gender inequality usually see lower levels of climate action. Climate action is calculated using a measure of the climate change mitigation policies set by countries.
This highlights that countries with lower levels of gender inequality usually take more action on climate change and are less vulnerable to the negative impacts of climate change, Andrijevic says. She notes that “improvements in gender equality contribute to climate resilience”, adding that gender equality is crucial “not only for women but for the society as a whole”.
Dr Astghik Mavisakalyan, a principal research fellow at Curtin University – who was not involved in the study – tells Carbon Brief that there is a two-way relationship between improved gender equality and increased climate resilience. She adds that progress in one can drive progress in the other to create a “virtuous circle of sustainable and equitable development”.
Measuring gender inequality
Gender inequality is a complex issue and can be tricky to measure. This study measures the gender inequality of a country using the “Gender Inequality Index” (GII), which was developed by the United Nations Development Programme (UNDP). (We note that this study does not include non-binary people in its analysis, or investigate transgender inequality.)
The index ranges from zero to one, where a higher number indicates higher levels of inequality between men and women. In this study, a GII value below 0.3 indicates low levels of gender inequality, whilst a value above 0.3 signifies high levels of inequality.
The GII is made up of three parts. The first part measures health using a combination of maternal mortality ratio (deaths due to complications from pregnancy or childbirth), and adolescent birth rate. Lower levels of maternal mortality and adolescent birth rate indicate better healthcare for women, and signify better gender equality.
The second part measures education and political empowerment by comparing the percentage of males and females in parliamentary seats and with secondary education. Mavisakalyan has found in her research that a greater representation of women in government can drive progress on climate policies. She tells Carbon Brief:
“Female representation in national parliaments leads countries to adopt more stringent climate change policies; and through this effect on the stringency of climate change policies, female representation leads to lower CO2 emissions.”
There are a range of possible reasons for this result. Mavisakalyan suggests that qualities such as “cooperation and carefulness” could be “more emphasised in females”. She also explains that female politicians reflect the needs of female civilians:
“It may be that female politicians’ preferences are similar to those of females in the general population, so they are indeed more concerned about climate change than their male counterparts, and they do reflect this concern in their policymaking.”
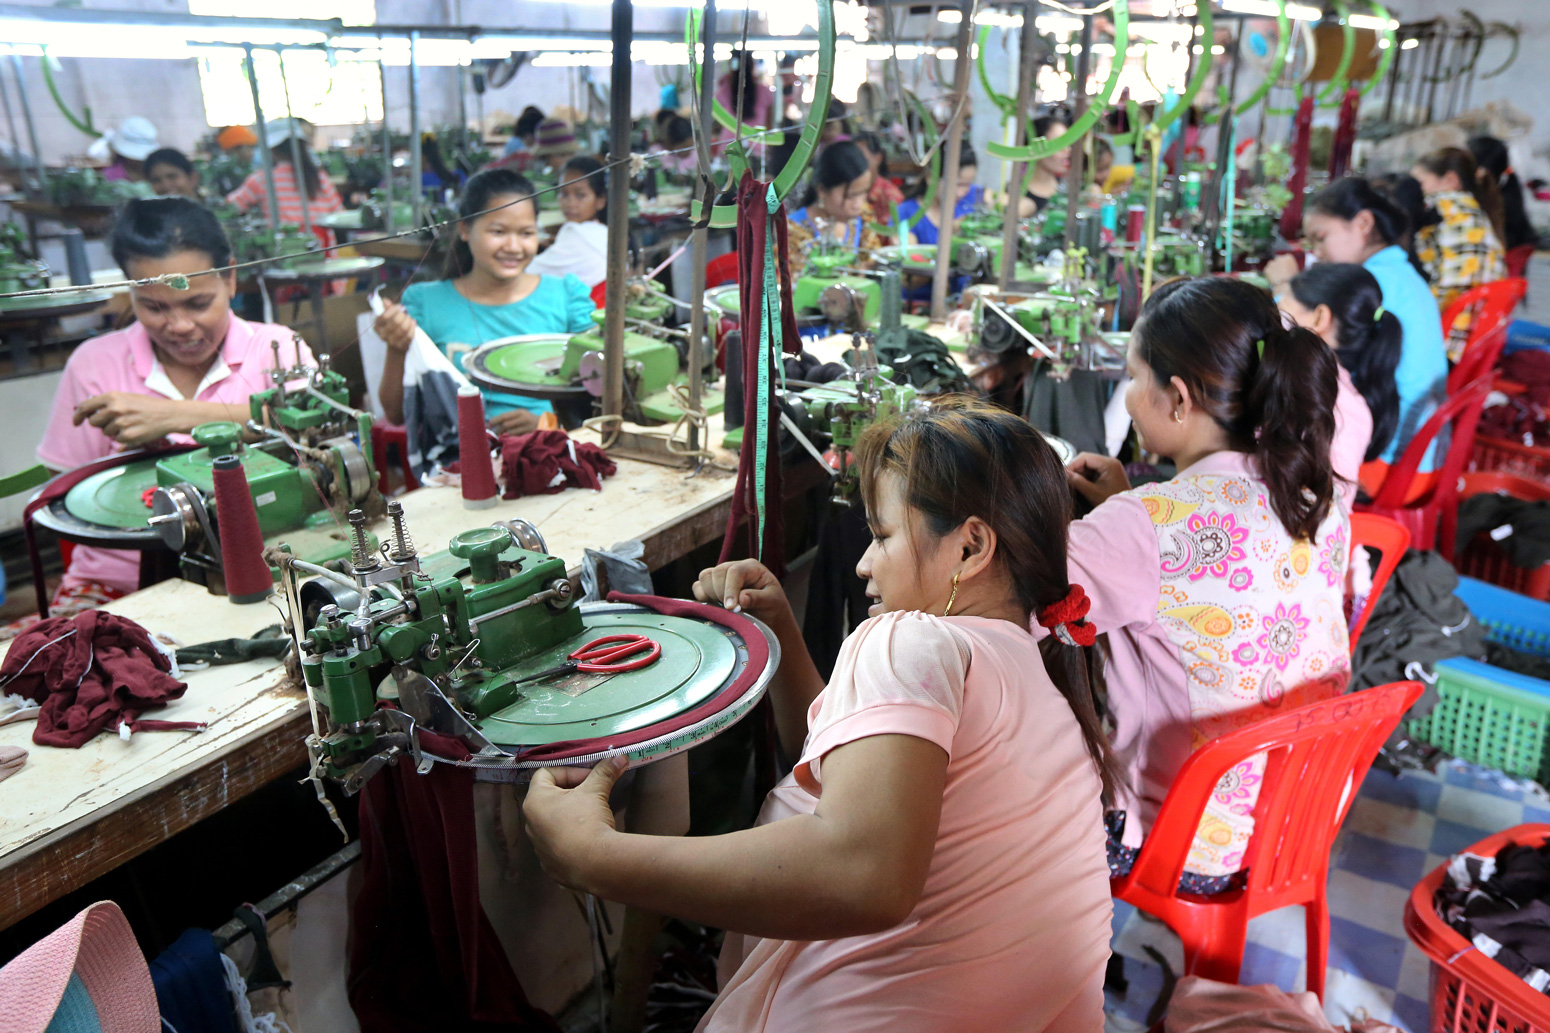
The final component of GII measures levels of female employment. Improving equality in the labour force provides women with “access to financial resources, to information and to different networks of decision making”, Andrijevic explains, making it key for improving “women’s adaptive capacity and resilience”.
How might gender inequality change in the future?
Scientists have developed a set of five narratives called “shared socioeconomic pathways” (SSPs) that outline how global society, demographics and economics might change over the next century. Much of the new study focuses on the first three SSPs, as these three scenarios cover the full range of possibilities concerning gender inequality.
SSP1 is a pathway focused on sustainability and equality. Development in this scenario emphasises inclusive development and low-carbon emissions, where gender inequality is low.
SSP2 is often called the “middle-of-the-road” scenario. In this scenario, social, economic and technological trends broadly follow their historical patterns. This means a continued, gradual improvement in levels of gender equality over the coming decades.
In SSP3, countries focus on achieving energy and food security goals within their own regions at the expense of broader-based development, with existing inequalities persisting or worsening over time. This scenario is characterised by high levels of gender inequality.
The plot below shows how global levels of gender inequality are expected to change in future SSPs by 2030 compared to their 2017 values. Each doughnut represents the total number of girls (top) or women (bottom) in the world in 2017, 2030 in SSP1, 2030 in SSP2, and 2030 in SSP3, respectively.
The orange segment of each doughnut shows the proportion of girls living in countries with high levels of gender equality, whilst the purple segment shows the proportion living in countries with high levels of inequality.
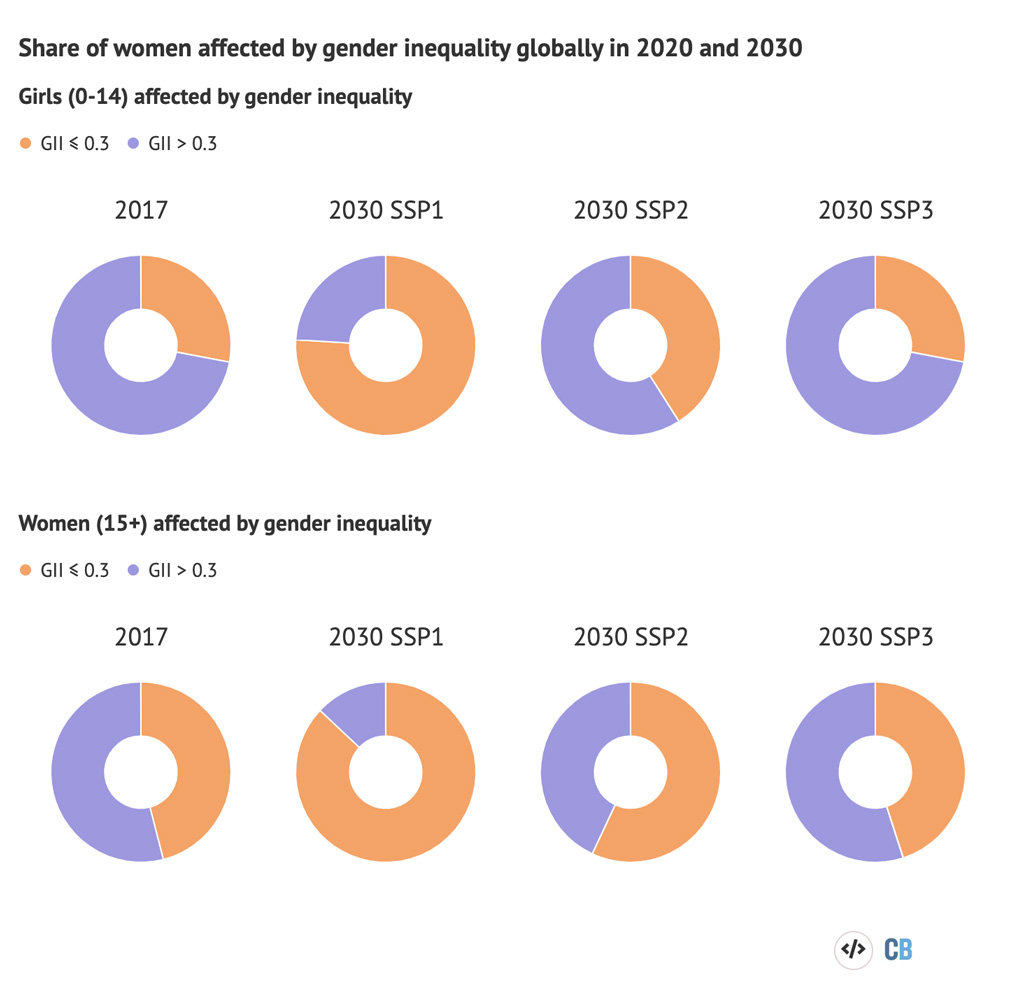
This plot shows that in 2017, 72% of girls and 54% of women were significantly affected by gender inequality. Whilst all of the SSPs tested show clear in gender equality for by 2030, the sustainable development pathway SSP1 shows the most significant improvements.
Gender inequality in developing countries
However, improvements in gender equality will not be the same across all countries. The maps below show the gender inequality in different countries in 2000 and 2017, as well as projected possible levels of gender inequality in 2050 in SSP1, SSP2 and SSP3. A high number indicates high levels of gender inequality.
Using the buttons in the chart legend, users can also see the breakdown of female health (red), empowerment (blue) and gender equality in the labour market (purple) in 2000 and 2017.
Gender inequality in 2000 and 2017, 2050 SSP1, 2050 SSP2, and 2050 SSP3. A higher number indicates a higher level of gender inequality. Female health (red), empowerment (blue) and gender equality in the labour market (purple) are also shown for 2000 and 2017. Graphic by Joe Goodman and Tom Prater.In this chart, each country is shaded according to its level of gender inequality. Countries with a GII below 0.3 have orange shading and low levels of gender inequality, whilst countries with a GII above 0.3 have purple shading and high levels of gender inequality.
The map shows that, in 2017, Europe, Australia, the US, and Canada had the lowest levels of gender inequality in the world, whilst Africa, South America and parts of Asia had notably high levels of inequality. Similar trends are seen for female health, empowerment and participation in the labour market.
In the sustainable development pathway SSP1, all countries see improvements in gender equality over the coming decades. Africa and South Asia see particularly rapid improvements within the next 20-30 years and, by 2050, only a few countries in Africa still have notably high levels of gender inequality. By 2100, the entire planet is expected to achieve a GII score of zero.
By contrast, SSP3 shows very little progress in gender equality from any countries, so the imbalance between developed and developing nations is maintained. This suggests that in SSP3, developed nations may also have a low ability to adapt to the changing climate, and would be particularly vulnerable to the resulting impacts.
Dr Laura McKinney, an associate professor at Tulane University who was not involved in the study, notes that SSP scenarios are not definite pathways of future social development. Instead they “use the data in a predictive manner to forecast hypothetical scenarios, based on assumptions of how we believe the data will behave”, she tells Carbon Brief.
Andrijevic adds that these scenarios provide a range of “possible futures” and are “a tool to explore ‘what-if’ scenarios of socio-economic development”. She adds that her paper “doesn’t mean that achieving gender equality automatically means climate-resilient societies”.
However, Natalie Elwell, a senior advisor at the World Resources Institute – who also was not involved in the study – believes that “social equity is an integral component of effective climate action”. As socioeconomic pathways are widely used in the climate community, they could be a good way to tie in gender inequality with climate change, she adds:
“I appreciate that the authors found a way to validate and present the evidence indicating the importance of gender equality for improved climate outcomes in a way that fits within the scenario planning tools that are widely used by the climate community…Perhaps this framing of the issue will provide some motivation to act and clarity on the pathway for action.”
Andrijevic, M. et al (2020) Overcoming gender inequality for climate resilient development, Nature Comms, doi:10.1038/s41467-020-19856-w
-
Why tackling gender inequality is ‘crucial’ for climate adaptation
-
The importance of gender equality for encouraging climate action