
Tourism responsible for 8% of global greenhouse gas emissions, study finds
Daisy Dunne
05.07.18Daisy Dunne
07.05.2018 | 4:00pmWorldwide tourism accounted for 8% of global greenhouse gas emissions from 2009 to 2013, new research finds, making the sector a bigger polluter than the construction industry.
The study, which looks at the spending habits of travellers in 160 countries, shows that the impact of tourism on global emissions could be four times larger than previously thought.
The findings suggest that tourism could threaten the achievement of the goals of the Paris Agreement, a study author tells Carbon Brief.
However, the results may still be underestimating the total carbon footprint of tourism, another scientist tells Carbon Brief, because they do not consider the impact of non-CO2 emissions from the aviation industry.
Tourism’s footprint
The global tourism industry is rapidly expanding. Fuelled by falling air travel prices and a growing global middle class, the number of international holidaymakers is currently growing at a rate of 3-5% per year.
The new study, published in Nature Climate Change, explores how the recent growth of global tourism has impacted greenhouse gas emissions.
Tourists contribute to climate change in a number of ways – through travel by air, rail and road, for example, and by consuming goods and services, such as food, accommodation and souvenirs.
For the new analysis, the researchers considered all of these factors together in order to calculate tourism’s “global carbon footprint”, explains study author Dr Arunima Malik, a lecturer in sustainability from the University of Sydney. She tells Carbon Brief:
“Our analysis is comprehensive and, hence, takes into account all the upstream supply chains to quantify the impacts of tourist spending on food, clothing, transport and hospitality.”
![]()
The research finds that, between 2009 and 2013, tourism’s annual global carbon footprint increased from 3.9 to 4.5bn tonnes of CO2 equivalent.
This figure is four times higher than previous estimates and accounts for 8% of global greenhouse gas emissions, the research finds. The rise is largely driven by an increased demand for goods and services – rather than air travel, the research finds.
The chart below shows the carbon footprint of individual purchased commodities related to tourism in 2013.
However, it is important to note that the study did not consider the impact of aviation’s non-CO2 emissions, such as contrails, says Prof Stefan Gössling, a tourism researcher from Linnaeus University in Sweden, who was not involved in the study. This means the study may have underestimated the total emissions from aviation, he tells Carbon Brief:
“Notably, the non-CO2 warming effects from aviation, which, calculated for a given year, make aviation twice or three times as climate-relevant, are not even considered in this paper.”
Travellers and destinations
The new study draws on data taken from 160 countries. For each country, the researchers calculated the total amount of emissions caused by its own citizens going on holiday (“residence emissions”) and as a result of tourists visiting the country (“destination emissions”).
Looking specifically at resident emissions, the research finds that the US has the largest carbon footprint of any country, followed by China, Germany and India.
This is shown on the chart below, which displays the total carbon footprint in 2013 for international (blue) and domestic (yellow) holidays taken by each country’s residents.
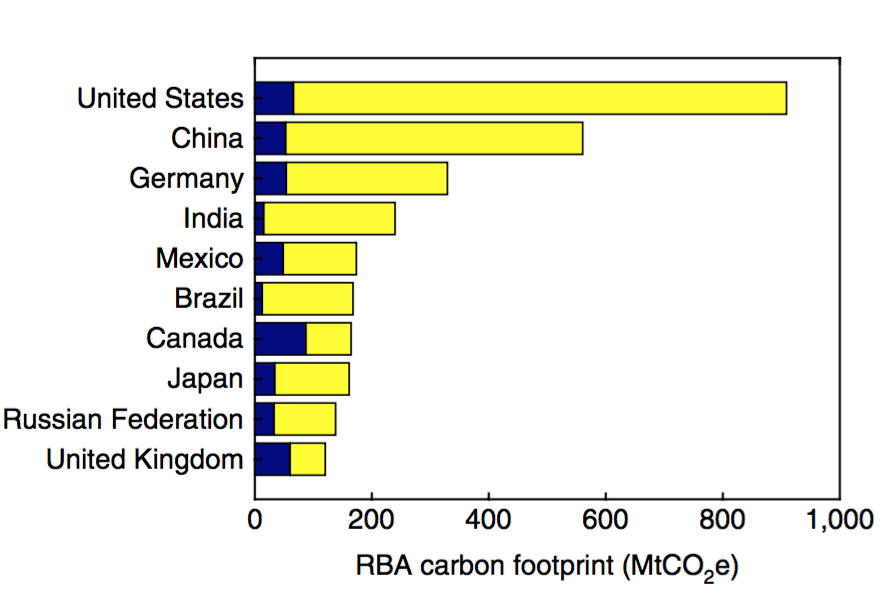
Total residence-based accounting (RBA) carbon footprint in CO2e for different countries in 2013 for international (blue) and domestic (yellow) holidays. Source: Lenzen et al. (2018)
The results show that domestic travel accounts for a large proportion of residence emissions in the US and China. This is likely to reflect the tendency of US and Chinese citizens to holiday within their own country, the researchers say.
Looking at destination emissions (the average carbon footprint per traveller once they arrive on their holiday), the researchers find that small islands, such as the Maldives, Mauritius and Cyprus, tend to have the highest international emissions.
This means that people choosing to holiday on these small islands are causing more emissions than those taking domestic trips. These emissions are likely to be related to a demand for private travel and luxurious goods and services, such as upmarket restaurants, hotels and shops, the researchers say.
The results are shown on the chart below, which displays the carbon footprints for destination countries per person in 2013 for international (blue) and domestic (yellow) holidays.
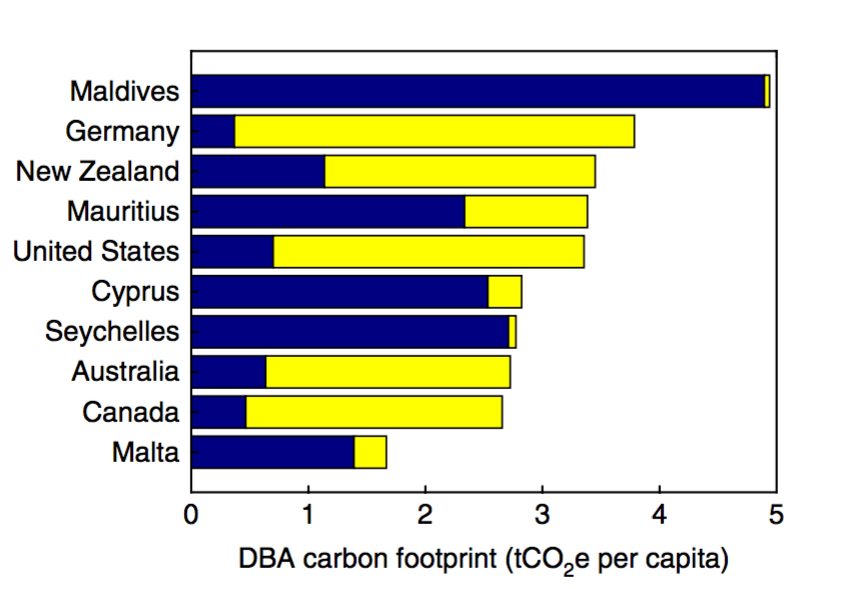
Per capita destination-based accounting (DBA) carbon footprint in CO2e for different countries in 2013 for international (blue) and domestic (yellow) holidays. Source: Lenzen et al. (2018)
The results also suggest that the tourism carbon footprint of many countries, such as Germany and New Zealand, is primarily being driven by domestic trips, says study author Dr Ya-Yen Sun, a senior lecturer in tourism at the University of Queensland. She tells Carbon Brief:
“Total domestic travel consumption is much higher than the total inbound tourism consumption in Germany and New Zealand. This is quite common for most countries – domestic travel against international travel is probably at the ratio of 10:1.”
‘Shouldering’ carbon
The researchers also calculated the “net” carbon footprints of each country by taking the difference between residence and destination emissions. By doing this, the impacts of domestic travel are cancelled out and the resulting balance reflects only international travel.
The chart below shows the net carbon footprints for a range of countries in 2013, on a per person basis. On the chart, countries with a net footprint close to zero are not shown.
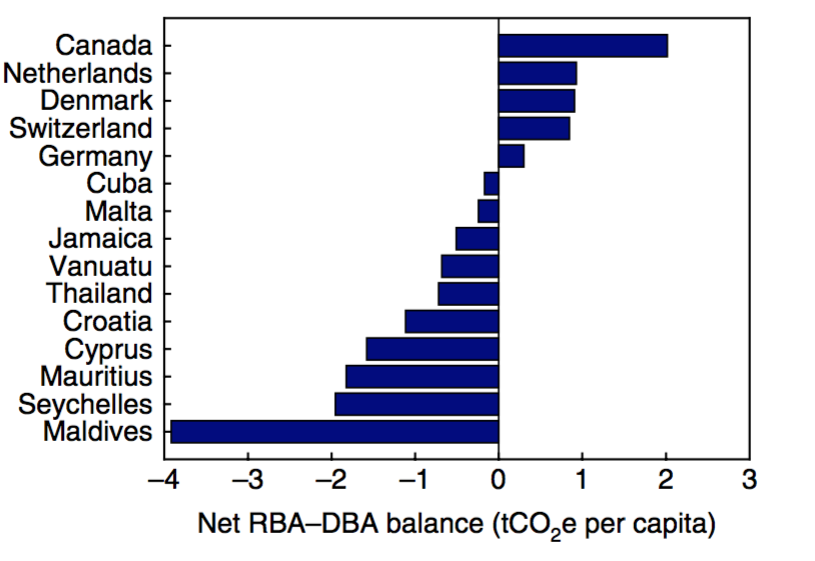
Net balance between “resident” (RBA) and “destination” (DBA) emissions (CO2e) for different countries in 2013. Countries with a balance close to zero are omitted from the chart. Source: Lenzen et al. (2018)
The results show that people from Canada, the Netherlands and Denmark can be considered “net travellers” – meaning that their carbon footprint in other countries far exceeds that of other tourists in their own country.
In contrast, people from the Maldives, Seychelles and Mauritius are “net hosts” – meaning they “shoulder much higher footprints from their visitors than they exert elsewhere”, the paper notes.
First class travel?
The analysis also shows that richer nations tend to have larger tourism-related footprints than poorer ones.
About half of the total global footprint of tourism from 2009-13 was driven by travel between countries with a per person gross domestic product (GDP) of more than $25,000, the research shows. In the UK, the GDP per person is just under $40,000 (£29,000).
Projections suggest that world’s average GDP will increase from $10,750 per year in 2017 to $13,210 per year in 2022. As the world gets richer, its tourism carbon footprint is likely to grow larger, the research suggests.
Using models of financial growth, the researchers find that tourism’s carbon footprint could reach 5-6.5bn tonnes of COeq by 2025. This figure would account for roughly 12% of current greenhouse gas emissions.
Much of this growth could be driven by continued economic growth in less developed countries, Sun says:
“Travel activity is largely determined by income level and the total outbound number is also influenced by the sheer population size. For developing countries that embrace rapid economic development with a growing population, they are very likely to change from net destinations to net origins [for tourists].”
Ecotourism fallacy
One finding of the new research is that those travelling far to partake in “ecotourism” holidays may be causing more harm to the environment than they believe, Sun says:
“One main problem with ecotourism is that it cannot help to address emissions associated with long-haul travel, which is a key factor to the overall trip carbon footprint. For example, a UK visitor flying all the way to Indonesia to engage with ecotourism will produce more emissions than locals with regular domestic travel.
“Thus, one key step to be low-carbon travel is to fly less, choose destinations that are close to home and pay to offset carbon emissions.”
Decision-makers should also play a role in limiting the growth of global tourism, he adds, possibly by introducing a carbon tax on international travel:
“[Policymakers should] support carbon taxes or carbon-trading schemes to encourage the speed of technology development of airline industries and other transportation sectors.”
Paris in peril
The findings suggest that tourism could threaten the achievement of the Paris climate goals, the scientists say in their research paper:
“At least 15% of global tourism-related emissions are currently under no binding reduction target as emissions of international aviation and bunker shipping are excluded from the Paris Agreement. In addition, the US, the most significant source of tourism emissions, does not support the Agreement.”
Imposing stricter regulations on aviation and shipping could be key to tackling tourism-related emissions, Sun says:
“[Policymakers should] incorporate emissions of international aviation and bunker shipping in targets such as those most recently drawn up under the Paris Agreement.”
In 2016, 161 countries agreed to “cap” their aviation CO2 emissions at 2020 levels. And, last month, countries agreed to cut shipping emissions by 50% in comparison with 2008 levels by 2050.
Update: This research paper was subject to a correction on May 7.
Lenzen, M. et al. (2018) The carbon footprint of global tourism, Nature Climate Change, doi:10.1038/s41558-018-0141-x
-
Tourism responsible for 8% of global greenhouse gas emissions, study finds
-
Tourism’s carbon footprint ‘four times larger’ than previously thought