Ros Donald
18.07.2014 | 5:00pmAtmospheric carbon dioxide levels broke modern records last year – and 2013 was one of the warmest years on record according to four major datasets. Sea levels continue to rise, and the oceans are getting warmer. The US National Oceanic and Atmospheric Administration’s State of the Climate, 2013 is a reminder of the many changes the world is experiencing.
The State of the Climate report, published by the Bulletin of the American Meteorological Society, is a different beast to the Intergovernmental Panel on Climate Change’s (IPCC) fifth assessment report. Both reports assemble multiple datasets to give a picture of the changes the planet is experiencing, but NOAA’s annual climate checkup doesn’t try to answer why certain events have occurred. Instead, it focuses on building a detailed picture year on year, chronicling the shifting state of the physical climate system.
NOAA has also created a summary that pulls out the report’s most striking results. We’ve picked five measures that help form this picture along with NOAA’s explanation of why they matter.
Carbon dioxide levels
Greenhouse gas levels in the atmosphere continued to rise in 2013. Atmospheric concentrations of carbon dioxide increased by 2.8 parts per million (ppm) last year, pushing the daily concentration of carbon dioxide measured at the Mauna Loa Observatory in Hawaii above 400 ppm on the 9th of May. Indeed, the average concentration for the month of June 2014 topped 400 ppm, as the graph below shows.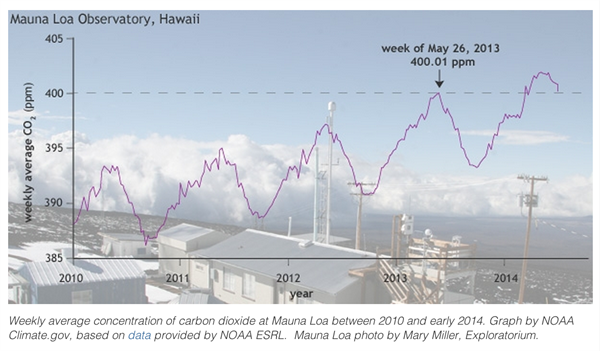
The report points out that readings in the Arctic registered 400ppm as early as 2012, while the global concentration is catching up fast. Overall, the global average atmospheric carbon dioxide concentration for the year was 395.3ppm.
The Mauna Loa reading is an important milestone for scientists. As NOAA points out, ice core records show carbon dioxide levels never exceeded 300 ppm during the last 800,000 years until the early 20th century. It says:
“Now, having exceeded 400ppm, we are in uncharted territory.”
Reacting back in 2013, for example, NASA’s Dr Erika Podest said the milestone is a “wake up call” that our actions in response to climate change must match the “persistent rise” in carbon dioxide.
Rising sea levels
Sea levels continued to rise. The blue areas on the map below show where average sea level in 2013 was above its long-term average. Sea level rose by as much as 20.32 centimetres above the 1993-2010 average – the dark blue areas. White areas show average levels, and places where sea level fell are brown.
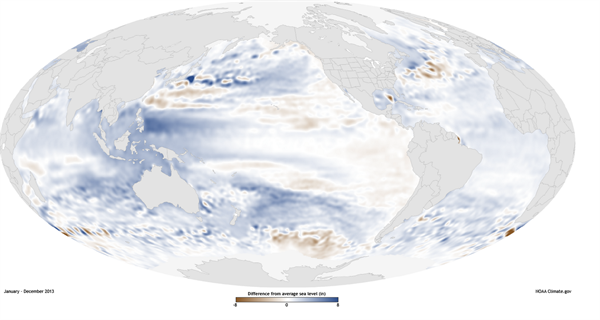
Over the year, the changes reflect natural fluctuations, such as La Niña-like conditions in the tropical Pacific and Indian Ocean creating a pile-up of warm surface waters, as well as longer-term sea level rise as the oceans warm and expand, and land-based ice melts.
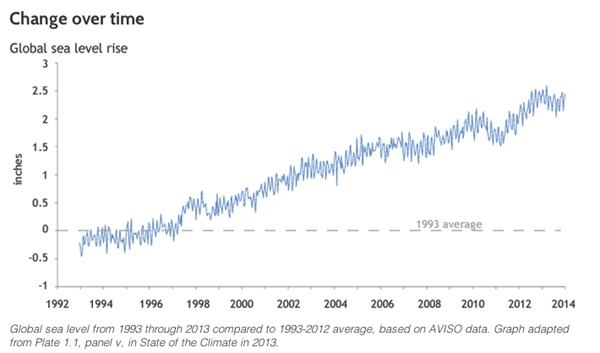
In 2013, global average sea level was 3.8 centimetres above the 1993-2010 average, which is the highest yearly average since the satellite record began in 1993.
Sea surface temperatures
Taking an average around the world, the report concludes that 2013 was one of the ten hottest years on record for sea surface temperatures. The north Pacific reached an historic high temperature, and there was substantial warming south of the Bering Strait and Gulf of Alaska, due to a persistent high-pressure system.
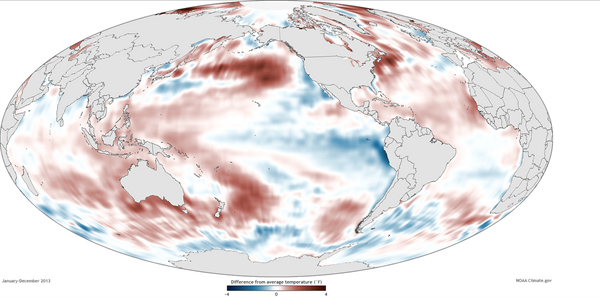
Unlike the prevalence of a La Niña in 2011 and 2012, 2013 saw neutral El Niño conditions in the tropical Pacific ocean. But natural patterns like El Niño, which influence the climate on a yearly or decade-to decade basis “have occurred against a backdrop of warming that has been occurring over the long term”, the report says. The graph below shows the steady rise in ocean surface temperature over time.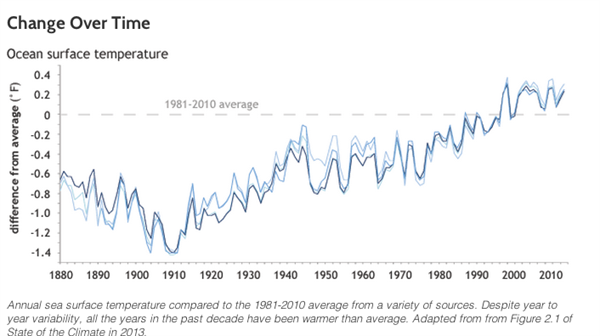
NOAA says sea surface temperatures play an important role in seasonal and yearly climate variations. Rising sea surface temperatures can make tropical cyclones and hurricanes more destructive, and have a huge effect on crucial ocean life like phytoplankton, which forms the basis of the ocean food web.
The poles
In March last year – the end of the Arctic winter, when sea ice has been expanding – ice extent was three per cent below the long-term average. 80 per cent of the ice pack at the winter maximum level was new ice that had just formed over the winter, meaning that little ice is surviving year to year.
At the peak of the melt season, ice extent shrank to 5.1 million square kilometers, 18 per cent below the 1981- 2010 average, but larger than 2012’s record low, NOAA says.
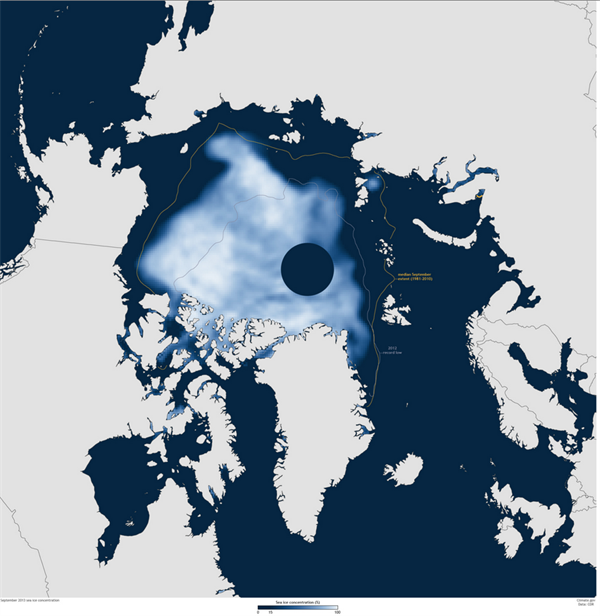
Over time, the Arctic continues to be cold enough in winter for the ice pack to form, but it’s getting thinner and more delicate, making it more likely to melt in the coming summer, the report says. 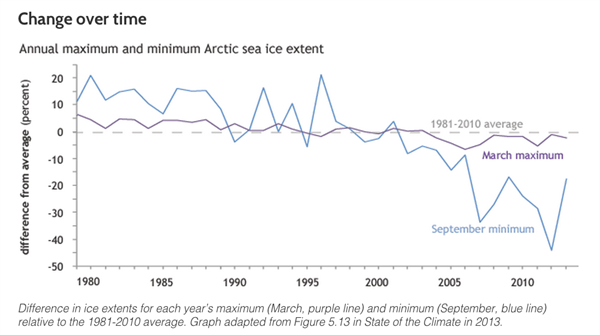
The Arctic is crucial to maintaining the climate’s balance, NOAA says. As well as providing the cornerstone for unique animals’ hunting, breeding and migrating habits, the ice’s white surface helps to cool the climate by reflecting sunlight back into space.
In Antarctica, temperature and pressure were above average across nearly the entire continent, and the ice sheet experienced its highest total surface melt during the austral summer of 2012-3 since 2004-5.
Yet readings in Antarctica also recorded an above-average sea ice extent throughout the year. The report says:
“A new daily maximum sea ice area of 19.57 million square kilometres was reached on 1 October 2013.”
Extreme weather
2013 saw a range of extreme climate events, from record temperatures in Australia and Greenland to the UK’s coldest March and May since 1962 and 1996. But 2013 will be remembered for the devastation wrought in the Philippines by Typhoon Haiyan. The report says:
“For most of 2013, it appeared that extreme heat and drought in Australia […] would be the singular and foremost climate story of the year. However, November saw the development, intensification and catastrophic landfall of super Typhoon Haiyan. Although Haiyan’s meteorological life cycle is measured in weeks, its impact on humanity within and beyond the region will be measured in generations.”
Striking in the early hours on 8 November, scientists believe Haiyan may be the strongest tropical cyclone ever recorded at landfall, with one-minute sustained winds at 196 miles per hour.
The graphic below shows tracks for the “thousands of Eastern Hemisphere tropical cyclones” documented between 1842 and 2012, NOAA says.
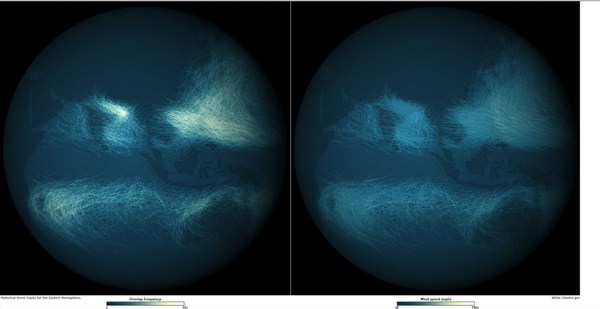
Historically high sea levels may have contributed to the storm’s destructive force, according to NOAA. It adds:
“Higher sea levels contribute to increased coastal flooding and impact during storm surge events.”
Climate checkup
Climate change affects humans and our surroundings in complex, varied and interlinked ways. By pulling together the year’s climate data from sources around the world, NOAA’s climate health check provides a meticulous chronicle of the many trends of a warming planet.
-
Typhoon Haiyan, record-breaking CO2 levels, rising seas and more: five measures of the state of the climate in 2013