
UK tops list of world’s biggest greenhouse gas emitters
Roz Pidcock
01.16.14The United States is responsible for a whopping 20 per cent of the warming the world’s experienced over the industrial period, according to new research. But when you look at emissions per person, the UK beats the US into first place.So which other countries are taking more than their fair share of the global warming pie?
Countries have contributed differently to the build-up of greenhouse gases in the atmosphere. So some countries could be considered more or less to blame for global warming than others.
A new study published in Environmental Research Letters puts that theory into action, ranking countries in order of how much their historical emissions have contributed to observed temperature rise over the industrial period.
Global rankings
The scientists from Concordia University in Canada examined each country’s greenhouse gas emissions between 1750 and 2005. Alongside carbon dioxide from fossil fuel burning and land use change, they included methane, nitrous oxide and sulphate aerosol emissions.
Some of the results perhaps aren’t too surprising. They show a small number of countries account for a large share of total greenhouse gas emissions.
The biggest emitters – US, China, Russia, Brazil, India, Germany and the UK – are together responsible for 63 per cent of total emissions. The US is way out in front, contributing more than double the emissions of China in second place.
Apportioning warming
The study expresses the weight of responsibility in a unique and striking way. The researchers translate each country’s historical emissions into a proportion of the global temperature rise we’ve seen so far.
This works for carbon dioxide because the gas has a fairly predictable relationship with temperature rise – if you know how much a country has emitted, you can work out how much temperature rise it’s caused.
For other greenhouse gases, it’s less straightforward because they don’t stick around in the atmosphere as long. But the scientists devised a way to weight each type of emission according to the lifetime of the temperature change it causes.
Using this method, the US becomes responsible for 0.15 degrees Celsius of warming – that’s close to 20 per cent of the total temperature rise we’ve seen so far.
China and Russia account for around eight per cent of emissions each, followed by Brazil and India with seven per cent. Germany and the UK come in sixth and seventh place with around five per cent each.
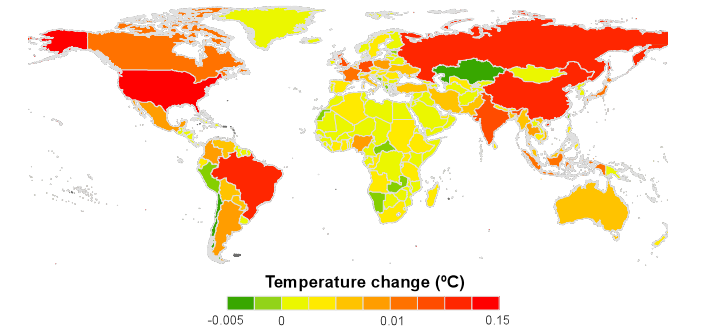
Historical contribution to climate warming by country. US leads the table with 0.15 degrees warming by 2005, with the UK coming in seventh. Source: Matthews et al., ( 2013)
The authors explain why the UK’s contribution may seem large given its small size. They say in the paper:
“The UK’s position in the top-seven emitters is strongly tied to historic use of coal, which constitutes a large fraction of their cumulative fossil fuel carbon dioxide emissions. By contrast, much more recent coal use in China has led to a much faster current growth rate of cumulative carbon dioxide emissions, and hence a contribution to climate warming that will continue to increase rapidly in the coming years”
Some less developed countries like Brazil sit quite high up in the rankings because they have been turning large amounts of forest into cropland. The authors explain:
“While some countries’ warming contributions are reasonably well defined by fossil fuel carbon dioxide emissions, many countries have dominant contributions from land-use carbon dioxide and non-carbon dioxide greenhouse gas emissions.”
Working out individual countries’ total historical emissions is a hugely complex task, and there’s quite a bit of uncertainty involved. That’s why the authors say in the paper their list should be considered a “reasonable best guess” and “one realization of a complex calculation rather than as a deï¬nitive country ordering”.
Disproportionate warming
The researchers experimented with an eye-catching way to illustrate the differences between countries’ emissions. In the map below, each country has been stretched or shrunk to reflect whether its emissions are high or low relative to its geographic area.
Some places look very distorted – Japan, India and most of western Europe including the UK, for example – indicating they’ve caused disproportionately more warming that their size would suggest.
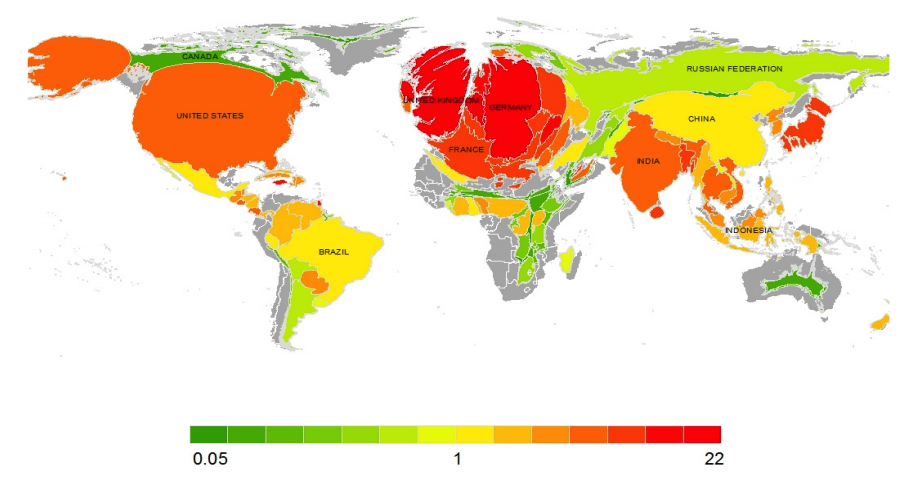
Countries’ climate contributions relative to geographic area. Red indicates countries with very high relative climate contributions, green indicates countries with very small relative climate contribution. Source: Matthews et al., ( 2013)
Canada and Australia are almost unrecognisably small because the countries are so large, the researchers note. Russia, China and Brazil stay roughly the same size, which could be interpreted as their contributions to climate change are in more or less in proportion.
People power
Accounting for population differences between countries is critical for assessing climate change contributions, say the authors. When you consider how many people live in each country, China and India drop to the bottom of the rankings, while the UK jumps into first place ahead of the US.
The top seven positions in this ranking are all developed countries, which the researchers say highlights the huge disparity between rich and poor countries with respect to per person emissions.
The scientists note in the paper that in most developed countries, per-capita emissions are above what’s needed to restrict global temperature change to less than two degrees warming above pre-industrial temperatures.
But while the the need to bring down greenhouse gases is clear, disparities between countries’ climate change responsibility will need to be resolved to move forward with an international agreement that’s considered fair, say the researchers.
The third part of a bumper report this year from the Intergovernmental Panel on Climate Change looks in detail at different mitigation options – and it’s due out in April, so not long to wait for a fuller discussion of these issues.