UK wind power can help meet peak winter demand, study says
Robert McSweeney
06.16.17Robert McSweeney
16.06.2017 | 12:01amWind power can make an important contribution to the UK’s electricity supply even in the depths of winter when demand is highest, a new study says.
Analysing past wind speeds and electricity demand, the researchers show that average wind power generally increases with demand during the year. And while wind power does drop in cold, still winter conditions, it picks up again when we get the very coldest weather.
This means wind power can help meet high and peak electricity demand during winter, the researchers say.
The findings are “clearly good news” for the UK’s electricity supply, another scientist tells Carbon Brief, but due to the variability of wind power, energy suppliers would still need to be able to call on other sources of electricity to help meet demand.
‘Seemingly helpful relationship’
Wind power is becoming an increasingly important part of the UK energy mix – even generating more electricity than coal did last year. But does this mean that wind energy can contribute when the UK needs it most? That’s the question the new study, just published in Environmental Research Letters, aims to answer.
Looking back over the period from January 1979 to March 2013, the researchers analysed how demand for electricity and average wind speeds have varied. They focused on weekdays and periods outside school holidays as people’s patterns of electricity use differ between workdays and time off.
To calculate historical average wind power, the researchers used a wind power model and a “reanalysis” dataset of wind speeds going back to the beginning of 1979. Reanalysis is where scientists feed observed climate data into a model to recreate past global weather patterns.
In their wind power model, the researchers assume an even spread of offshore and onshore wind turbines across the UK and its surrounding waters. This is to capture the general variation in wind power across the country rather than specifically where wind turbines are currently sited.
Their results shows a “clear seasonal cycle in demand,” the paper says, which decreases in summer and increases in winter. Electricity demand tends to be highest in winter because there are fewer daylight hours and colder temperatures. This means more lighting and more heating (as some is powered by electricity rather than gas) during the winter months.
Happily, average wind power seems to follow a similar pattern. This “seemingly helpful relationship” comes down to the typical weather of the UK’s different seasons, the paper says:
“This reflects the variation in temperatures and wind speeds with season, with calmer, warmer conditions in summer and cooler, windier conditions in late autumn and early spring.”
You can see this in the chart below, which shows how average wind power (on the y-axis) varies with electricity demand (x-axis). Wind power and demand are higher towards the top and the right of the chart, respectively. Average wind power is shown as its “capacity factor” – the amount of wind power generated relative to the maximum the turbines could produce.
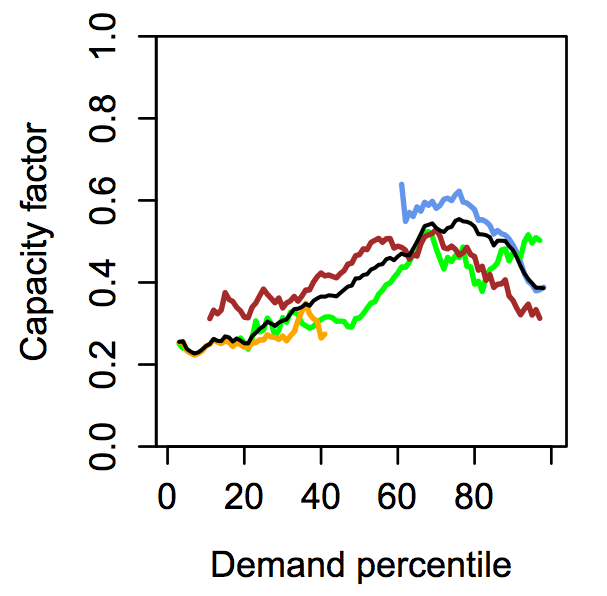
Chart showing average UK wind power capacity factor (y-axis) against electricity demand as a percentile (x-axis). The black line shows the whole year, while coloured lines indicate season: spring (green), summer (orange), autumn (red) and winter (blue). Source: Thornton et al. (2017)
The black line shows how average wind power and demand vary across the whole year. Broadly, average wind power goes up as electricity demand increases, the study finds. This relationship doesn’t hold when you get up to very high electricity demand, but we’ll come back to that shortly.
For specific seasons, both average wind power and electricity demand are at their lowest for the year in summer (shown by the orange line). Wind power and demand tend to be higher in spring (green) and autumn (red), and higher still in winter (blue).
This means that, in general, we get more wind power during the times of the year when we need more electricity.
Peak winter demand
So, coming back to the issue of very high demand, what happens to average wind power?
The chart below describes what happens in a bit more detail. It’s similar to the previous chart, but it focuses specifically on winter. From the black line you can see that average wind power in winter drops by around a third – from a capacity factor of about 0.6 to around 0.4 – as demand increases. Then, at the very peak of demand, there’s a small uptick in wind power again.
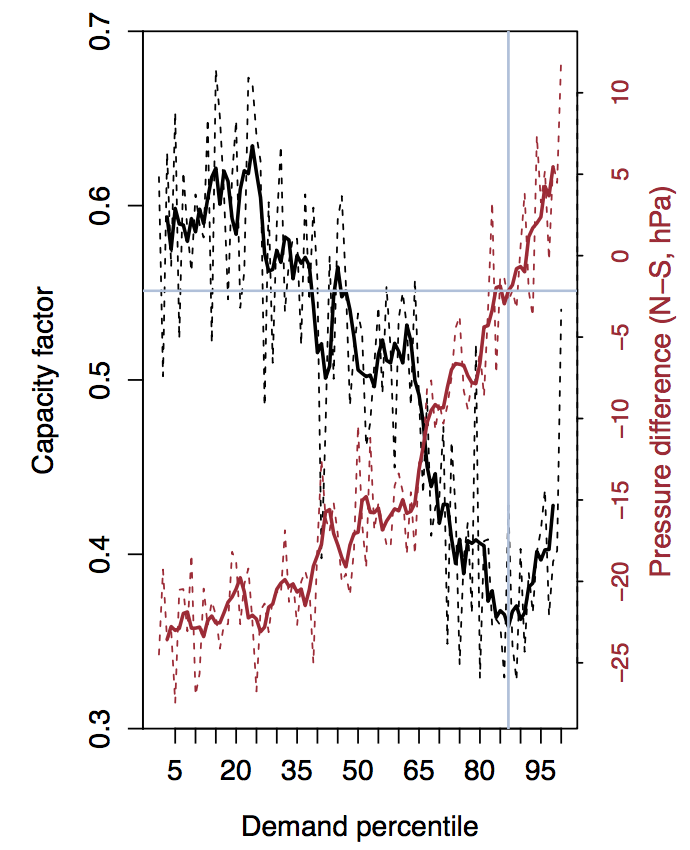
Chart showing average UK winter wind power capacity factor (black line) against electricity demand as a percentile (x-axis). The red line shows the difference in air pressure between two regions north and south of the UK. The grey lines indicate where the minimum in wind power occurs and shows that for very high demand (to the right of this line) wind power begins to increase again. Source: Thornton et al. (2017)
This fall and then rise in wind power is a result of the weather patterns that tend to affect the UK – and northern Europe more widely – during winter, explains lead author Hazel Thornton, manager of the climate change adaptation team at the UK Met Office. She tells Carbon Brief:
“Warmer periods in the UK are associated with warmer, windier, westerly flow conditions, where air originates over the Atlantic and moves eastwards across the UK. For example, stormy conditions associated with passing low-pressure systems give warmer, windier conditions.”
“In contrast, when a high-pressure pattern establishes itself over or near the UK the wind direction reverses, bringing cold and generally calmer conditions to the UK.”
In other words, a UK winter tends to get either mild and windy weather or cold and still weather. This means that during chilly spells when electricity demand is high – think of all those portable heaters wheeled into offices and electric blankets turned up to maximum – winds are often fairly light.
But, when winter electricity demand peaks – i.e. in the very coldest conditions the UK sees – wind power picks up again.
This happens when a high pressure system strengthens, sandwiching the UK between high pressure to the north, near Scandinavia, and low pressure to the south, over southwestern Europe. This brings very cold, but windy conditions, says Thornton:
“This weather pattern explains the eventual increase in average wind power during peak demand. However it is worth noting that not all high demand days have high wind power, with certain weather patterns giving low wind power availability.”
You can see this in the red line in the chart above, which shows the difference in air pressure between two regions north and south of the UK. As the grey lines indicate, this also coincides with peak electricity demand and the uptick in wind power.
‘Good news’
The results show that wind power “can contribute to the supply mix during high and peak demand,” the paper concludes.
This is “clearly good news for the National Grid,” says Dr Andrew Ross, associate professor of dynamic meteorology at the University of Leeds, who wasn’t involved in the study.
However, there is still a lot of variability in wind production, Ross notes, and energy suppliers would need to be able to call on other sources of electricity to meet demand. This could include importing electricity from other European countries, but there is a risk that demand would be high on the continent at the same time, he adds:
“The fact that cold conditions are often widespread across much of Western Europe in winter may limit options for importing excess capacity from neighbouring countries.”
Ross also picks up on another of the paper’s findings, which shows that offshore wind power tends to be less affected by winter weather patterns than onshore wind. He explains:
“Sea temperatures are much less variable than land temperatures in winter due to the high heat capacity of the sea and this in turn leads to less variability in near surface temperatures and winds. Not only do offshore wind farms provide higher mean power output, but they may also be relatively less affected by variability in winds, particularly in cold winter conditions.”
This suggests that offshore wind may be better placed to help with security of supply than onshore wind, the paper says.
Update 19 June: Article updated to add the second chart to show the uptick in wind power at peak demand more clearly.
Thornton, H. E., et al. (2017) The relationship between wind power, electricity demand and winter weather patterns in Great Britain, Environmental Research Letters, doi:10.1088/1748-9326/aa69c6