Mat Hope
24.07.2014 | 2:40pmAs an ever-increasing number of countries consider exploiting their shale gas resources, and researchers scramble to understand what a production boom could mean for the climate, two new pieces of research appear to come to opposite conclusions.
What is the climate impact of shale gas?
Since gas has about half the emissions of coal when it’s burned for electricity, it has been touted as a ‘bridging fuel’ for countries seeking to decarbonise their economies to use as a stop gap on the way to a low carbon electricity system.
But as we’ve explored before, scientists are struggling to establish the full impact of increased shale gas production on the climate, due to methane that escapes during the extraction process – known as fugitive methane emissions.
Two papers released this month examine what the actual climate impact of natural gas is. At first glance they seem to show opposite things. The graph on the left, taken from a paper by Robert Howarth appears to show natural gas electricity generation emissions – the towering left bar – can be much higher than coal’s. The second graph, from Heath et al, appears to show the opposite – that coal’s generation emissions (on the left) are much higher than those from both conventional and shale gas.
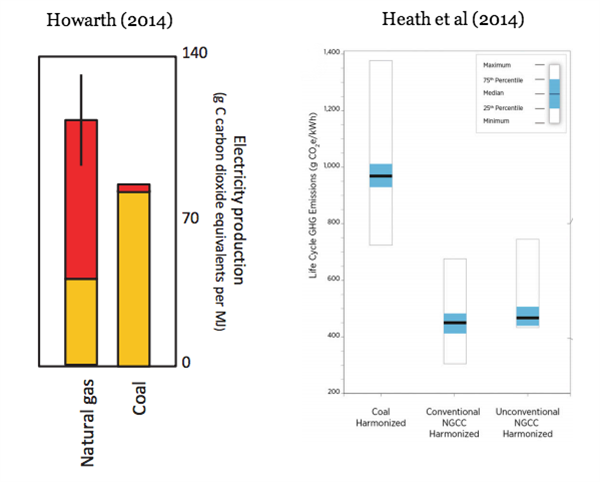
Both papers examine the ‘lifecycle emissions’ of the fuels: the amount of gas emitted from extraction to combustion. So why is there such a large discrepancy between two papers?
In short, it’s because Howarth’s data includes an estimate of fugitive emissions, while Heath et al’s doesn’t.
If you remove the fugitive emissions element (the red chunk on the graph above) from Howarth’s data, you get a very different picture. Convert the data so both graphs use the same units, and the paper’s results look like this:
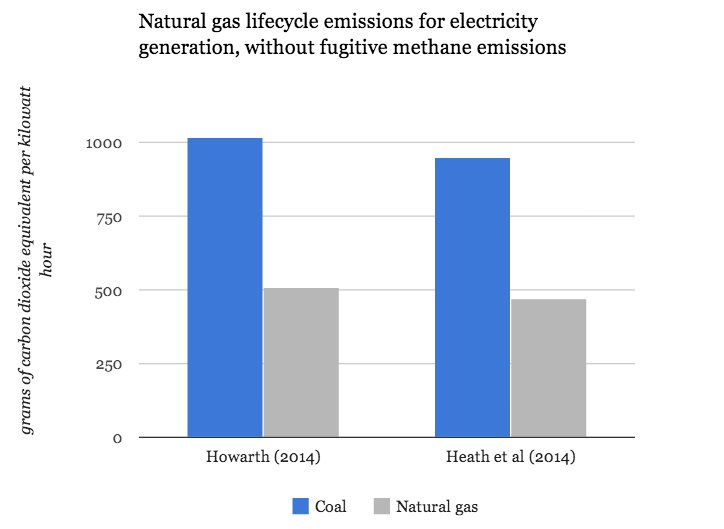
Sources: Howarth (2014) and Heath et al (2014). Graph by Carbon Brief. Heath et al’s median value is used for both coal and gas.
Here we see the papers obviously agree that without accounting for fugitive methane emissions, the emissions from gas are much lower than coal.
This illustrates just how important understanding fugitive methane emissions is to calculating the climate impact of gas. So why doesn’t Heath et al’s graph include them? In short, because fugitive emissions data remains contested.
Contested evidence
Fugitive emissions are a problem because methane is a potent greenhouse gas – approximately 25 times more powerful than carbon dioxide over a 100 year timescale.
There’s currently a wide range of estimates about how much methane escapes during gas production. Estimates of gas leakage rates are expressed as a percentage of total production.
We’ve put some of the key estimates of methane leakage rates in the chart below:
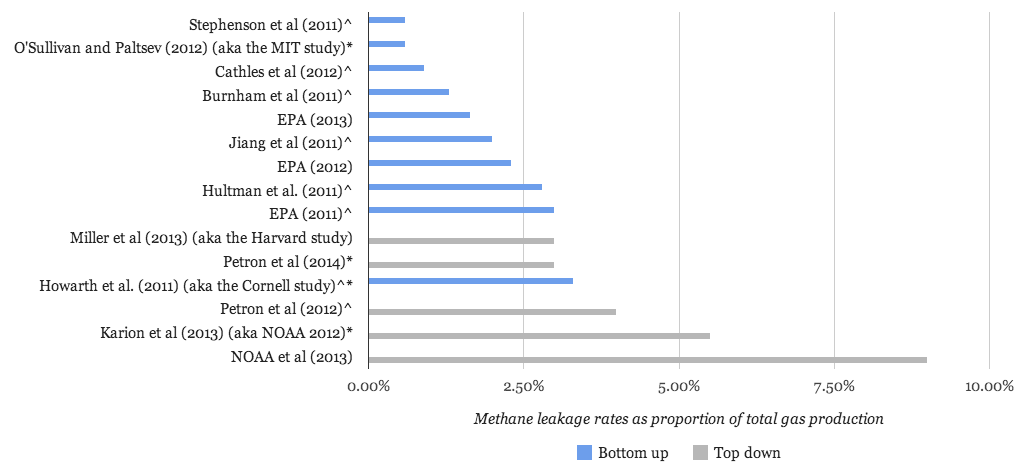
Source: Various, see this Google Doc for details. Graph by Carbon Brief. Note: ^ means value is for unconventional – i.e. shale – gas wells only, * means the value in the graph is the mid-estimate or mean of a range where a ‘best estimate’ is not given.
There’s a number of reasons the results have such a wide range, which we’ve covered in detail here. Perhaps the most important is how the data was collected.
Broadly speaking, there are two approaches to measuring fugitive emissions: bottom up and top down. Bottom-up approaches, the blue bars on the chart above, are better are measuring emissions from a particular well, but don’t necessarily accurately reflect the emissions of the whole production process. Top-down approaches tend to come out with higher measurements, the grey bars, as they potentially capture a wider source of emissions.
As you can see from our chart, Howarth’s research gives some of the highest estimates of fugitive emissions for the studies using a bottom up approach – hence his contention that gas can be more polluting than coal.
The main reason Heath et al don’t include fugitive emissions in their graph is because researchers are a long way from agreeing a standard or average leakage rate.
So who’s right? At the moment, the jury is out. Gas is only cleaner than coal if the leakage rate is below 3.2 per cent, according to one estimate. Some studies now suggest the amount of gas leaking from wells could be as high as nine per cent. But opinions differ on which studies are more reliable.
Both Howarth and Heath et al’s papers highlight the need for better fugitive emissions data. Without it, policymakers trying to curb emissions can’t make informed choices about whether to ramp up natural gas production.
The proliferation of studies since the issue first hit the scene in 2011 means such data is gradually being collated. As countries consider whether to emulate the US and undertake their own dash for gas, the task becomes increasingly urgent – as these papers’ differences illustrate.
Howarth, R.W. 2014. A bridge to nowhere: methane emissions and the greenhouse gas footprint of natural gas. Energy and Science and Engineering, vol. 2, no. 2, pp. 47-60
Heath, , G.A., O'Donoughue, P., Arent, D.J., and Bazilian, M. 2014. Harmonization of initial estimates of shale gas life cycle greenhouse gas emissions for electric power generation. PNAS Early Edition.