
Explainer: Why the sun is not responsible for recent climate change
Zeke Hausfather
08.18.17Zeke Hausfather
18.08.2017 | 4:31pmWith a total solar eclipse sweeping across North America, everyone is suddenly paying attention to the sun. One of the most common sceptical arguments against human-caused climate change is that changes in solar activity, rather than just CO2, is playing the biggest role.
At first glance, it seems to make intuitive sense: the sun is a massive nuclear fusion reactor a million times larger than Earth, it is responsible for almost all the energy reaching our planet, and in the past few decades scientists have learned that solar activity varies significantly over time. Indeed, changes in the distribution of sunlight reaching the Earth clearly change the temperature dramatically on a daily and annual timescale.
However, since 1970 global temperatures have shot up by almost 0.7 C, while the amount of solar energy reaching the Earth has actually declined. Similarly, the upper atmosphere is cooling while the lower atmosphere warms, a clear fingerprint of warming from greenhouse gases rather than the sun.
This evidence suggests we can rule out a major solar influence on recent warming.
Moving in opposite directions
Satellites have been directly monitoring the amount of the sun’s energy reaching the Earth since the late 1970s. Before that, researchers kept careful records of the number of “sunspots”, dark patches on the surface of the sun that are strongly related to solar output.
Combining older sunspot measurements with modern satellite observations, scientists have put together estimates of the sun’s output – called Total Solar Irradiance, or TSI – for the past 400 years. There is still some debate around how much solar output changed in the past, with some reconstructions suggesting more variation than others.
The plot below shows the solar TSI reconstruction from Naval Research Laboratory Total Solar Irradiance-2 (NRLTSI2) model (red line) – one of the ones with larger changes in solar output over the past 150 years – alongside the surface temperature record jointly produced by the UK Met Office Hadley Centre and the Climatic Research Unit at the University of East Anglia (black line).
Annual global mean surface temperature from HadCRUT4 in black in degrees C, along with NRLTSI2 TSI data in watts per metre squared. Lowess-smoothed curves are shown via dashed lines. Chart by Carbon Brief using Highcharts.The temperature and TSI values shown in this plot are not intended to be directly comparable. Dr Gavin Schmidt, director of NASA Goddard Institute of Space Studies, tells Carbon Brief that it would take around a seven watts per metre squared change in TSI to result in 1C warming, meaning that the observed rise in solar activity between 1880 and 1980 would result in only 0.1C warming.
There are indirect effects that need to be accounted for as well. Increases in solar UV output increase the formation of ozone, which is itself a greenhouse gas. This could at most double solar’s contribution to warming, taking it to 0.2C.
This shows that solar has only had a small impact of global temperatures over the last century or so, says Schmidt:
“Just as for the other drivers of change (such as deforestation, air pollution and greenhouse gases) we can calculate the fingerprint for these variations in time throughout the climate system from the surface to the mesosphere [in the upper atmosphere]. When we match that up with what we have observed over time though, the solar contribution is small –- close to zero over the last 50 years, and perhaps as large as 10% since the late 19th century.”
A slight decrease in solar activity
It is also worth noting that almost all of the minor warming contribution from fluctuations in the sun’s output occurred before 1970.
In recent decades, when global temperatures have risen most steeply, TSI has been flat or even slightly declining, says Schmidt:
“The period of greatest warming – since about 1975 – has coincided with a slight decrease in solar activity.”
Solar output in the satellite era, when we have much higher confidence in the records, is shown in the figure below. Each black dot represents daily total solar irradiance, while the red line is a longer-term average.
Satellite-based daily Total Solar Irradiance (TSI) in watts per metre squared from 1976-2016 via PMOD. Red line represents a lowess-smoothed fit. Chart by Carbon Brief using Highcharts.There is a clear cycle in solar activity of around 11 years. This has some effect on short-term climate, though it tends to average out over longer time periods. For example, the unusually low solar output in after 2009 may have contributed to slower warming of the Earth’s surface between 1998 and 2013.
Atmospheric ‘fingerprint’
The lack of an increase in solar activity after 1970 is one major argument against a solar role in modern warming. Another is the cooling in a layer of the upper atmosphere known as the stratosphere.
If changing solar output were driving warming, the whole atmosphere would warm due to the addition of incoming solar radiation. In contrast, if warming was due to greenhouse gases, the lowest layer of the atmosphere – the troposphere – and surface would warm, while the upper atmosphere would cool as greenhouse gases trapped heat and prevented it from escaping the troposphere.
The figure below shows what has actually happened since 1950. The upper chart shows a clear cooling trend in the stratosphere, while the lower chart shows the warming of the troposphere and Earth’s surface. This is the “fingerprint” of warming from CO2 and other greenhouse gases, though recent declines in stratospheric ozone also play a large role in stratospheric cooling.
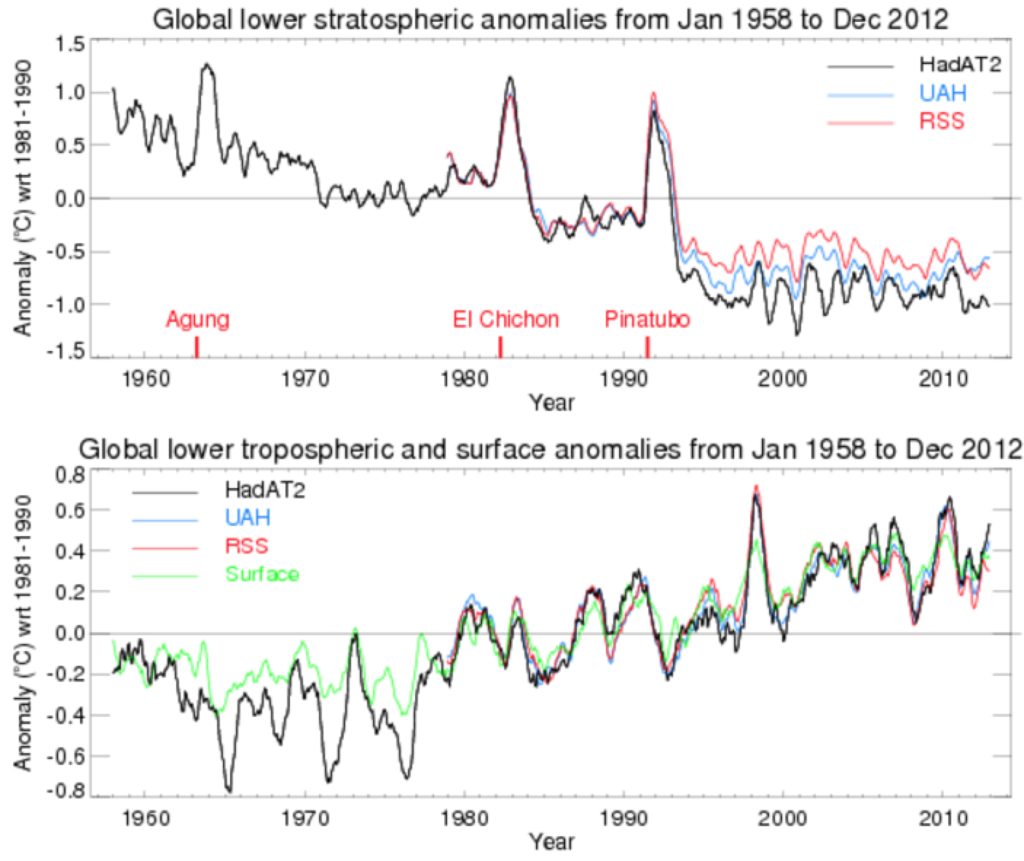
Global lower stratosphere (top) and troposphere (bottom) temperatures between 1958 and 2012. Figure from the UK MET Office HadAT. The CO2 cooling signal is clearer and more differentiable from ozone-driven stratospheric cooling in higher levels of the stratosphere.
Schmidt describes this evidence as “the biggest mismatch”. He tells Carbon Brief:
“If the warming at the surface was related to solar forcing, the upper atmosphere would also be warming. But it hasn’t been – it has been cooling, exactly as predicted from the effects of CO2 increases.”
Grasping at cosmic rays
With no discernable increase in solar activity, proponents of solar influence on modern warming have turned to other possible explanations. One that has gained traction in recent years is the idea that galactic cosmic rays may play a role in the Earth’s climate.
Galactic cosmic rays (GCRs) are high energy particles from beyond our solar system that regularly bombard the Earth. When solar activity is high, the “solar wind” – a stream of particles emitted from the sun – acts to reduce the number of GCRs that enter the Earth’s atmosphere.
Some research has found that GCRs in the atmosphere can play a role in cloud formation, with higher levels of GCRs potentially leading to more low-altitude clouds. These low-altitude clouds can influence the Earth’s climate by reflecting incoming sunlight back into space.
This has led some to suggest that changes in solar activity could influence the Earth’s climate by changing cloud formation.
However, the GCR hypothesis suffers from the same fundamental problem as total solar irradiance: it is moving in the wrong direction. Since 1960, the amount of GCRs reaching the Earth has increased, as shown in the figure below. If GCRs were a major influence on climate, this would result in cooling, not warming, over the past 50 years.
Daily Galactic Cosmic Ray (GCR) counts from the neutron monitor at the McMurdo Station in Antarctica. Yellow line represents a lowess-smoothed fit. Chart by Carbon Brief using Highcharts.Other recent research has also cast doubt on the role of GCRs as a major factor in the Earth’s climate, suggesting that their effect on cloud formation is far too weak to make much of a difference.
Taken together, these three lines of evidence show that solar variations are not driving modern climate change, says Dr Mike Lockwood, a solar physicist at the University of Reading. As he concludes for Carbon Brief:
“Most-importantly, the observed height profile is all wrong: a total solar irradiance increase would drive higher temperatures at all heights in the atmosphere, not just the surface, whereas the data show that while the lower atmosphere (and surface) have warmed, the stratosphere has cooled. The only mechanism that predicts this is greenhouse gas trapping of thermal infrared radiation from Earth’s surface.
Secondly, the long-term trend in solar activity since 1985 has been weakly downward whereas that in surface temperatures has been a strong rise. This also eliminates other proposed mechanisms, such as high cloud production by cosmic rays.
And the third is that you simply cannot put the observed levels of CO2 into the atmosphere without causing warming of about the magnitude observed.”
-
Explainer: Why the sun is not responsible for recent climate change
-
Is the sun to blame for recent climate change? Zeke Hausfather explains