Analysis: China’s CO2 emissions surged 4% in second half of 2020
Lauri Myllyvirta
03.01.21Lauri Myllyvirta
01.03.2021 | 4:42pmA surge in China’s output of carbon dioxide (CO2) in the second half of last year pushed the country’s emissions above their 2019 total, despite the impact of the coronavirus pandemic, new analysis for Carbon Brief shows.
While emissions fell approximately 3% in the first half of the year amid lockdowns, the second half made up for lost time, with emissions climbing more than 4%. In total across 2020, CO2 emissions increased by 1.5% compared with 2019, based on analysis of the country’s annual statistical communique.

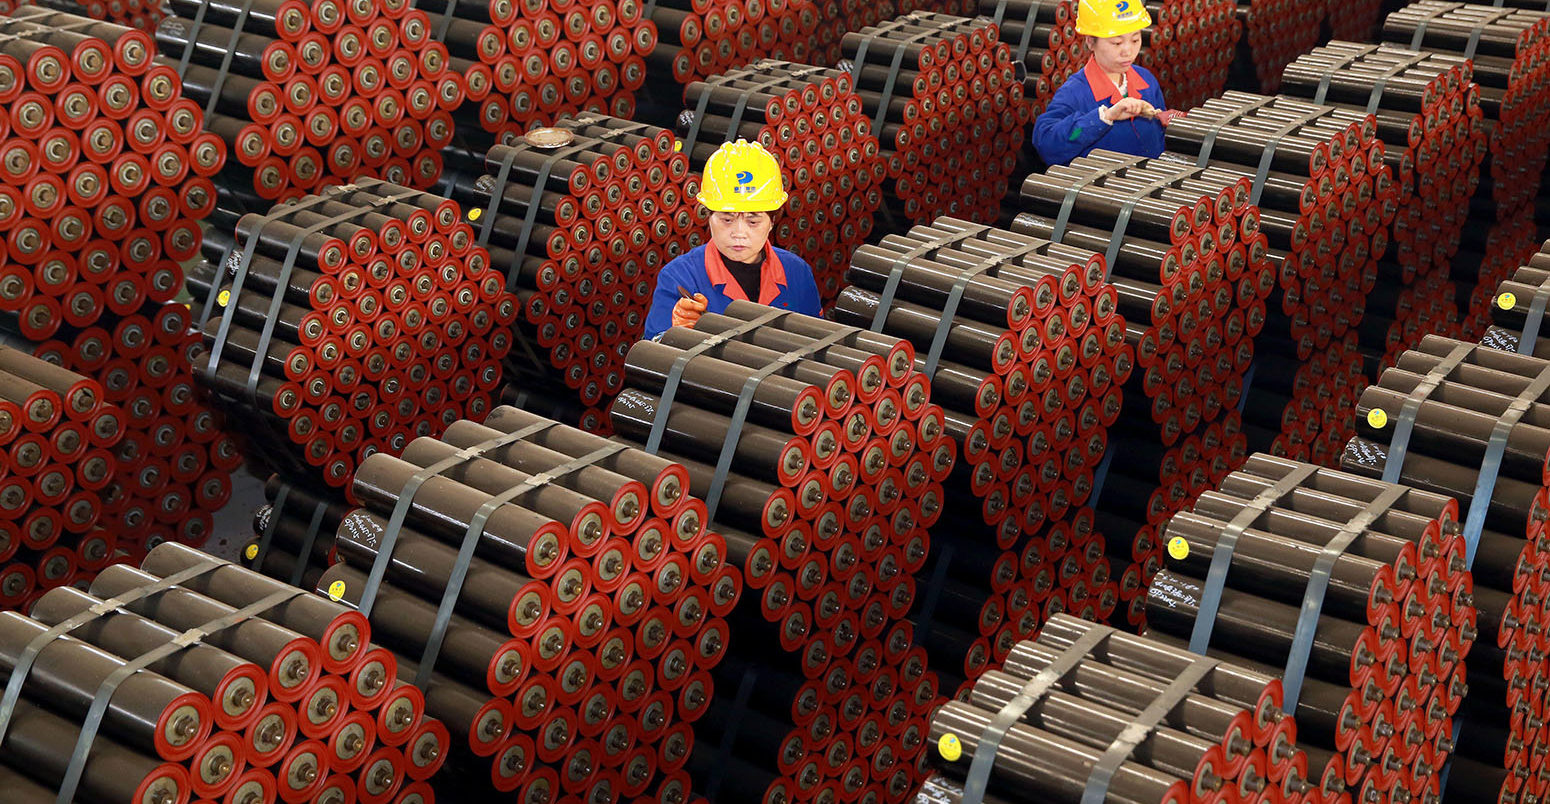
China’s return to economic growth after its first Covid-19 lockdown has relied on stimulating polluting sectors, such as construction and heavy industry. This saw the country’s consumption of coal, oil and gas all growing dramatically in the second half of the year, despite the pandemic and the government’s new pledge to target carbon neutrality by 2060.
The new data highlights the significance of China’s new five-year plan targets, due to be released at the annual legislative session starting on Friday. The plan is unlikely to set targets that would stop the growth in CO2 emissions, but is likely to slow it down.
Surging emissions
In early 2020, severe lockdown measures to tackle the unfolding coronavirus pandemic saw China’s CO2 emissions drop by 10% year-on-year during February and March. As restrictions were lifted, however, emissions quickly surged past pre-Covid levels, going on to record an estimated 3% year-on-year increase in the third quarter of 2020.
Analysis of the full-year data in China’s new statistical release points to an even larger increase in the fourth quarter, pushing the overall total for 2020 to 1.5% above that seen in 2019. This emissions surge is shown in the chart below, with the change during the first half of 2020 marked yellow and the second half in red.
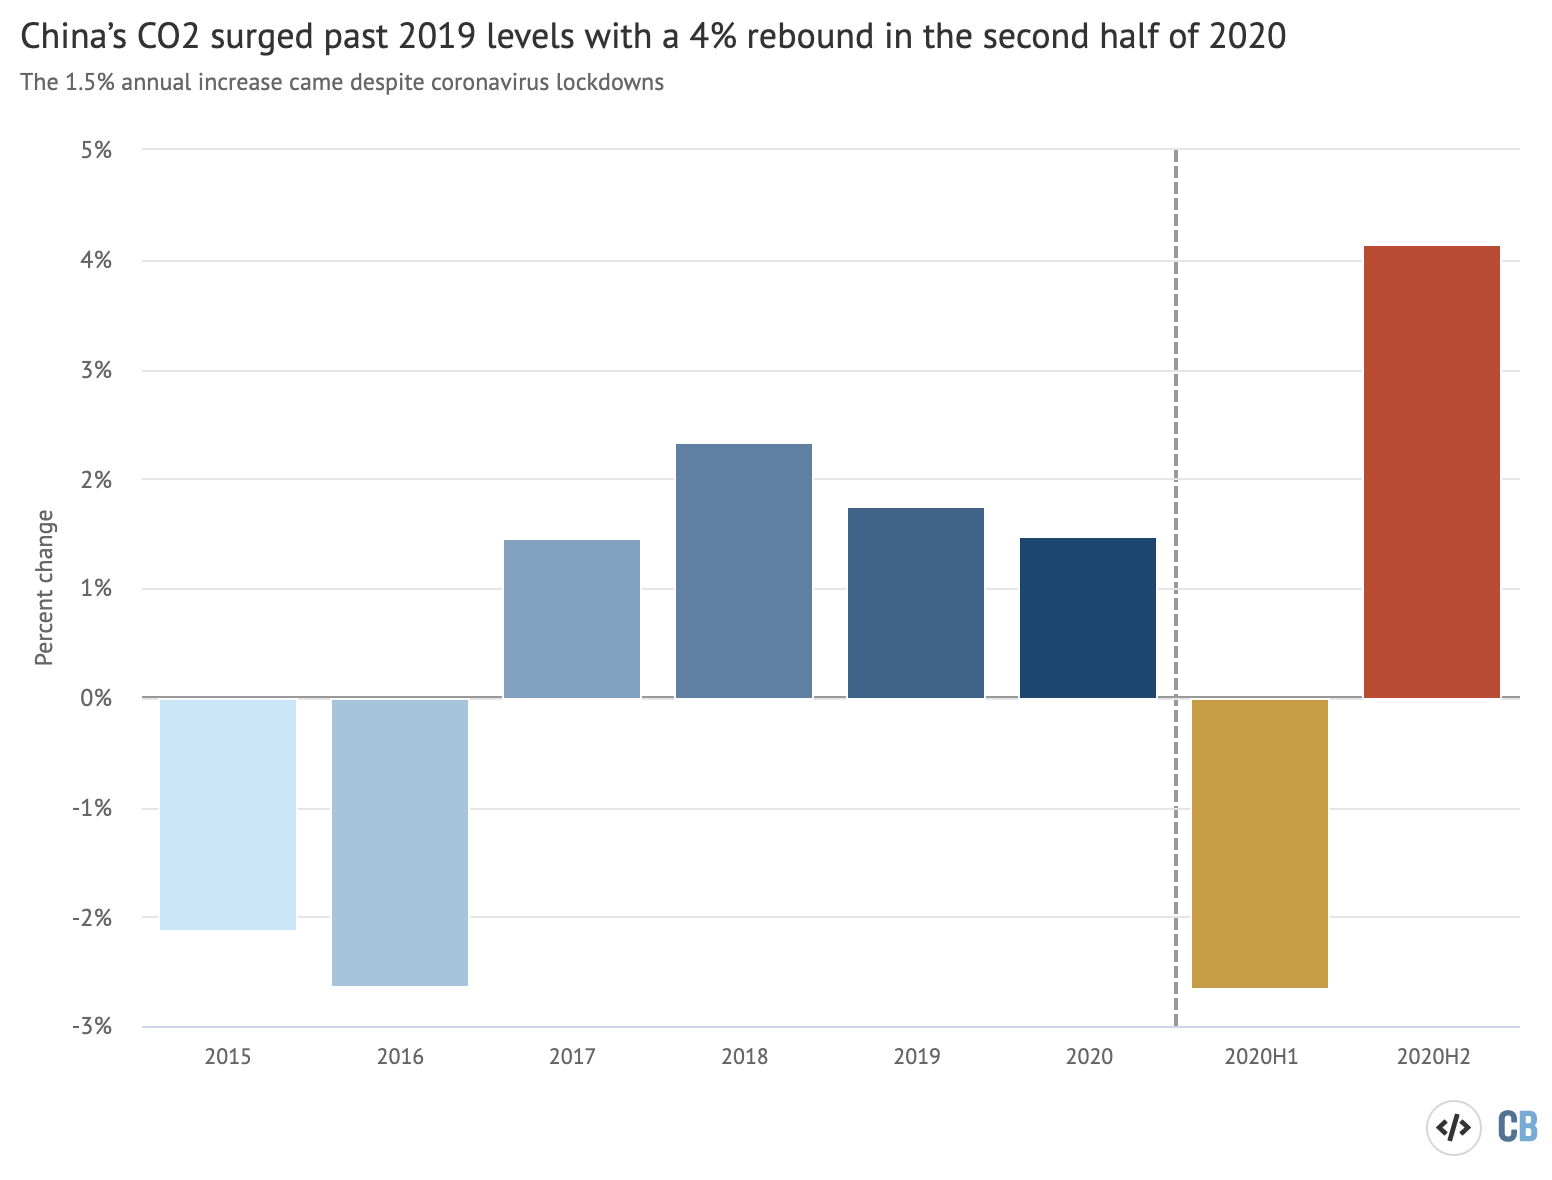
Annual growth of China’s CO2 emissions, 2015-2020, calculated from the Statistical Communiques on Economic and Social Development. The annual changes in 2020 are broken down to show the effect of the economic shock from Covid-19 in the first half of the year and from the heavy industry-led recovery in the second half. The disaggregation to the first and second half of the year is based on data from news reports on energy statistics for the first half of the year and monthly industry data from WIND Financial Terminal. Chart by Carbon Brief using Highcharts.
Whereas the annual increase of just 1.5% continues the recent downward trend in China’s emissions growth, the surge in the second half of the year points in a different direction.
On the surface, the annual increase in China’s coal consumption also looks modest, at just 0.6% across 2020 – compared to growth of 1% in 2018 and 2019. Yet this, too, hides a rapid uptick in coal demand during the second half of 2020.
Since coal demand reportedly fell 2.3% in the first half of the year, full-year growth of 0.6% implies that consumption in the second half must have been approximately 3.2%, shown in the chart below alongside other key indicators of China’s energy and emissions.
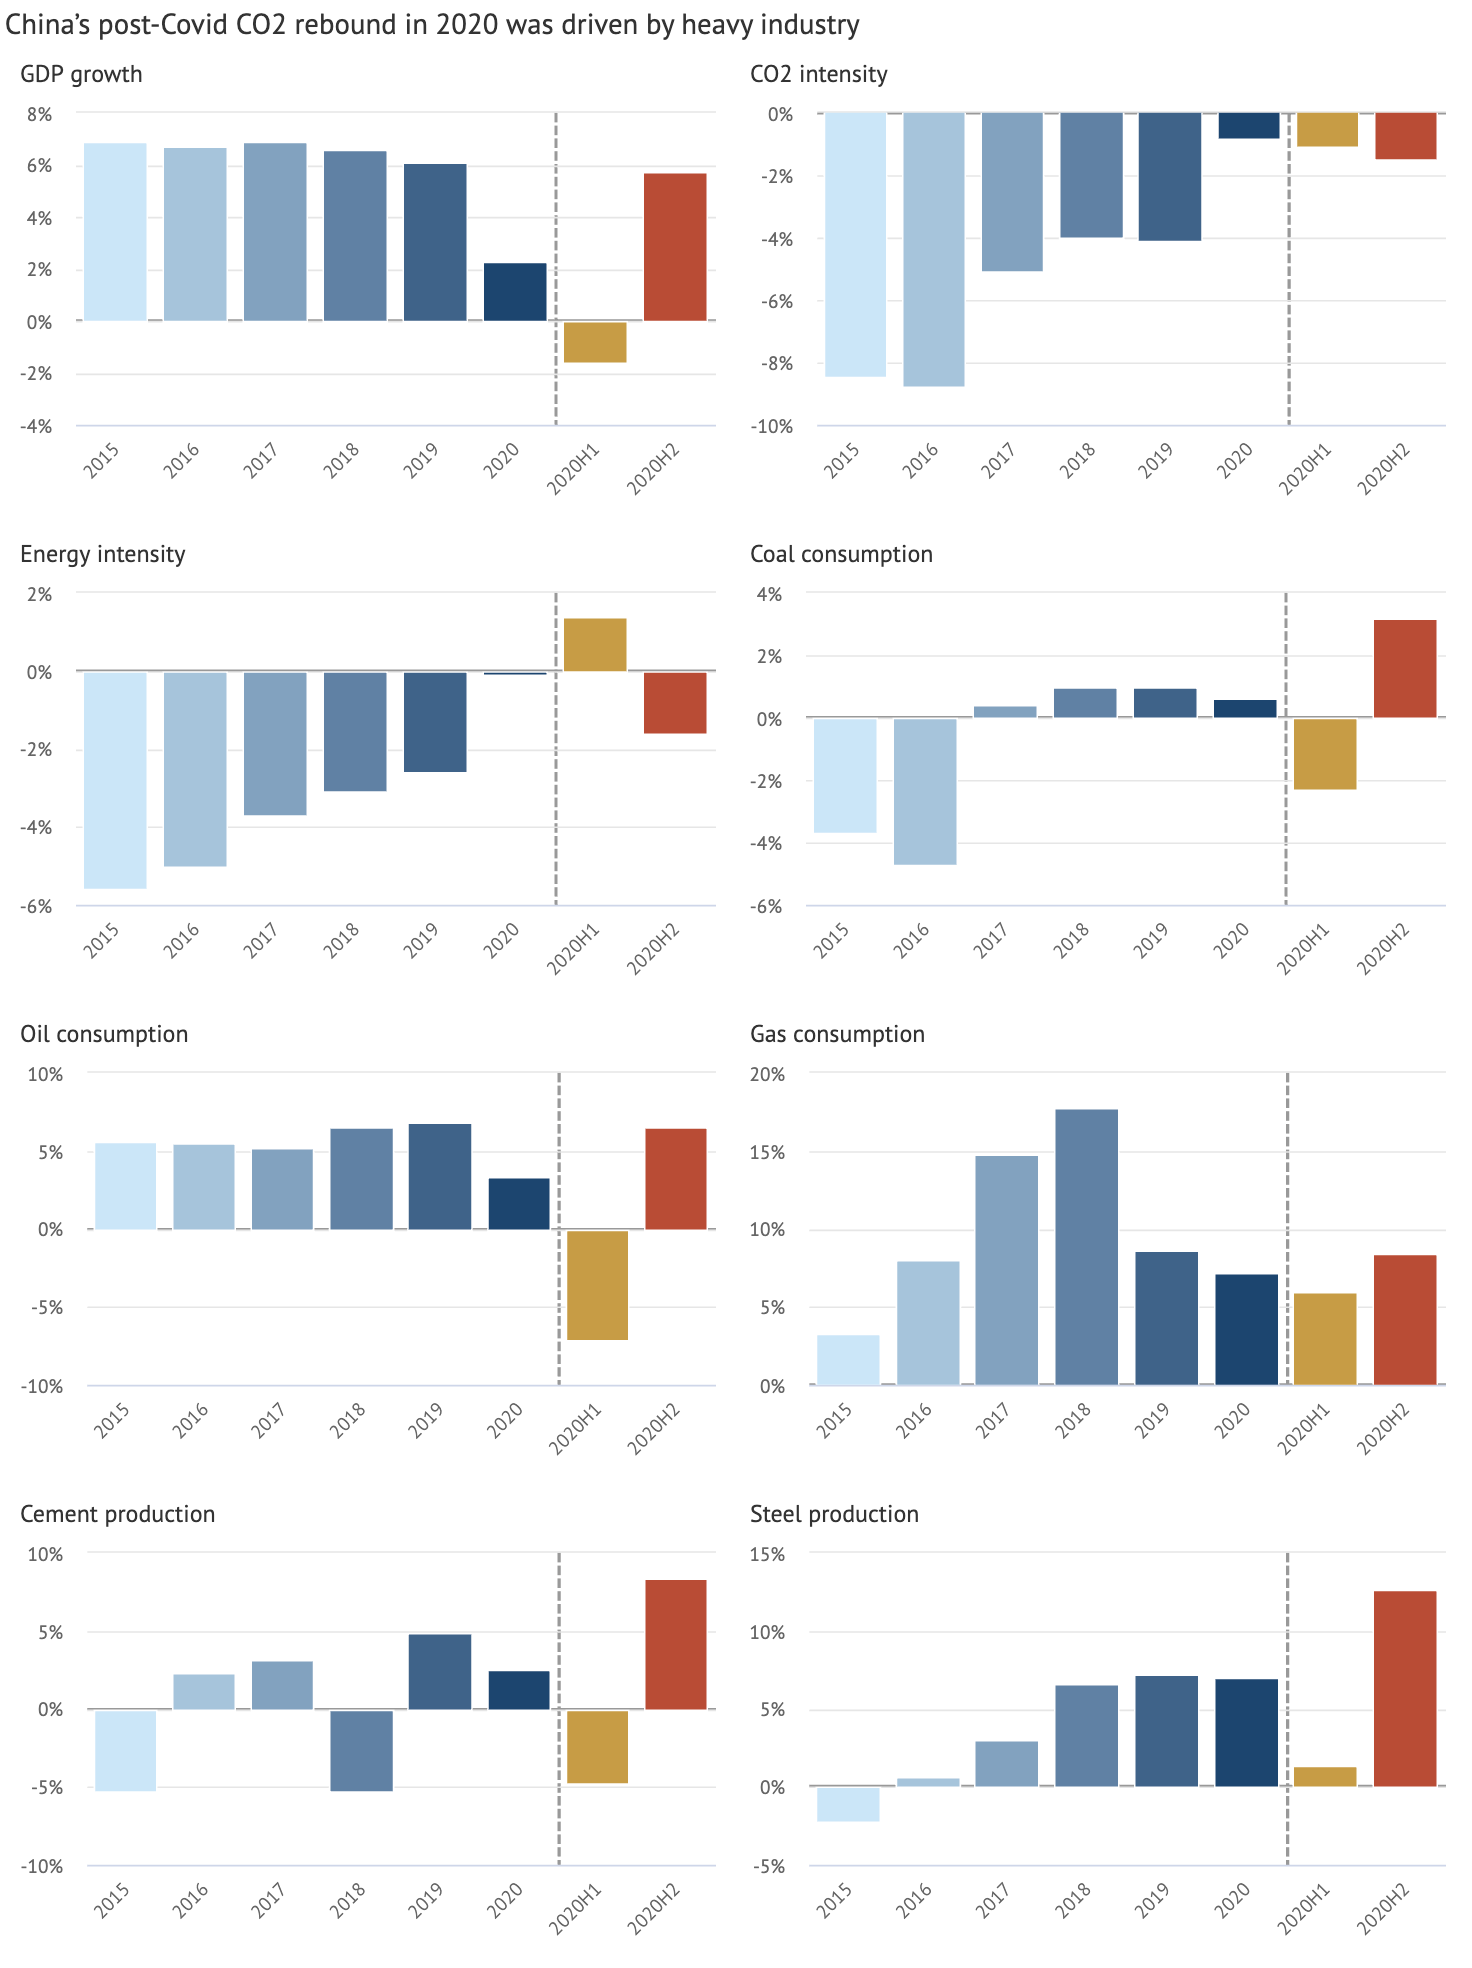
Compilation of key indicators related to CO2 emissions, 2015-2020, from China’s annual Statistical Communiques on Economic and Social Development. The annual changes in 2020 are broken down to show the effect of the economic shock from Covid-19 in the first half of the year and from the heavy industry-led recovery in the second half. The disaggregation to the first and second half of the year is based on data from June industrial statistics, news reports on energy statistics for the first half of the year and monthly industry data from WIND Financial Terminal. Chart by Carbon Brief using Highcharts.
Similarly, oil demand fell by at least 7% in the first half of the year (and demand for refined oil products fell 15%), according to official data – and OPEC estimates a 7.1% fall in crude demand. The second half of 2020 then saw a rebound of 6.5%.
Cement output contracted by almost 5% in the six months to June before increasing dramatically, by 8%, in the second half of the year.
There are major uncertainties about the economic and industrial data for the first half of the year, with official statistics appearing to understate the contraction in activity. However, the rebound in emissions in the second half of 2020 is in line with other data sources.
Across the full year of 2020, the communique suggests electricity demand grew by 3.1% and thermal generation (predominantly coal and gas) by 2.1%, so the generation mix became modestly cleaner even as power-sector emissions continued to increase. Power generation from wind and solar grew about 15%, nuclear 5%, solar 9% and hydro 4%.
Total energy use grew by 2.2% in 2020, according to the statistical communique. Even taking the official GDP number at face value, this means the country achieved a mere 0.1% improvement in energy intensity and a very modest 0.8% gain in CO2 intensity of the economy. (These are the energy use and emissions per unit of GDP, respectively.)
The communique reports the improvement in CO2 intensity as a round number, at 1%, but a more precise figure can be worked out from the reported increases in the consumption of coal, oil and fossil gas.
What drove the emissions increase?
The sharp rebound in China’s energy use and emissions output reflects the pattern of “dirty recovery” that has been emerging since mid-2020. Policymakers doubled down on the old playbook of stimulating the dirtiest and most energy-intensive sectors – construction, heavy manufacturing – to offset weakness elsewhere.
This pattern is readily apparent from the statistics on steel production: crude steel output grew 7% in 2020 and steel products by 10%, some four times as fast as GDP.
Steel production is the largest emitting sector for CO2, as well as air pollutants. It is also a key indicator of construction volumes as most steel is used for construction projects.
China’s policy response towards post-pandemic recovery has, thus, been distinctly different from other countries, which supported household incomes and consumption through income transfers. This, in turn, has served to boost China’s export manufacturing industry.
China’s approach helped deliver a positive GDP number, but is a further setback to efforts to pursue “high quality” growth or green the economy.
A contributing factor to the surge is the failure of many local governments to enforce controls on coal power and steelmaking capacity. Enforcing the 2020 steel capacity targets alone would have avoided 300m tonnes of CO2 emissions (MtCO2) per year, by a conservative estimate, equivalent to the overall 4% increase in China’s CO2 emissions in the second half of 2020.
(A recent, unprecedented environmental inspection of the National Energy Administration heavily criticised the regulators for expansion of coal power and energy-intensive industries in the eastern part of the country, where new capacity is supposed to be strictly controlled under the country’s air quality policies. See Carbon Brief’s detailed Q&A explaining the potential significance of the criticism for China’s climate policies.)
The pattern of China’s rebound differed starkly from expectations. The IEA had projected in April that China’s energy consumption would fall 4% in 2020, implying an even larger fall in CO2 emissions. However, the agency noted in November, that emissions were on track to increase.
What does the emissions surge mean for China’s climate targets?
The modest 0.8% improvement in CO2 intensity during 2020 means China has comfortably exceeded its Copenhagen accord target of a 40-45% reduction from 2005 to 2020, as reported CO2 intensity had already fallen 48% by 2019.
This means the increase in overall CO2 emissions in 2020 remains consistent with China’s international climate commitments, under which it has left room for emissions to continue growing until the late 2020s.
However, an acceleration in the emissions growth rate in the second half of the year is poorly aligned with the target of peaking emissions before 2030, especially as the pledge to reach carbon neutrality before 2060 requires rapid reductions in emissions after the peak.
Furthermore, fossil fuel growth goes beyond limited short-term increases in demand as it is built on the continued expansion of long-lived infrastructure.
China dominated investments in new coal power plants in 2020, opening three-quarters of the world’s newly funded capacity. It also accounted for more than four-fifths of newly announced coal power projects.
A total of 38 gigawatts (GW) of new coal – about one large coal plant per week – was added to the grid and a total of 73GW of planned new projects were announced, while less than 9GW was retired. Meanwhile, new projects in the rest of the world contracted sharply.
All eyes on the five-year plan
Both the ongoing and accelerating emissions growth and the accelerating investment in fossil-fuel infrastructure are facts that Chinese leader Xi Jinping must have been well aware of when making the pledge to target carbon neutrality by 2060.
Therefore, Xi’s pledge could be read either as a domestic signal to turn around these trends – or an international one to put a green veneer on an economy that he thinks will continue to increase emissions until late in the decade.
The key indication of which way the leadership leans will be the energy targets for 2025 that will be released as a part of China’s 14th five-year plan.
The overarching plan will be released at the annual session of China’s largely ceremonial legislature, starting on Friday. This will include a limit on total energy consumption and a target for the share of non-fossil energy – the sum of renewable energy and nuclear.
Together, these two targets will largely determine the maximum level for China’s CO2 emissions in 2025, with a bit of give depending on the exact mix of fossil fuels.
A range of more specific targets will be released in late 2021 or early 2022, as the specific plans for energy, renewable energy, coal and other sectors, as well as the CO2 peaking action plan being developed by the environmental ministry, are rolled out.
The surge in China’s CO2 emissions in the latter part of 2020 shows a clear need to manage growth in heavy industry and accelerate deployment of clean energy, if China’s goals to peak and decline emissions are to be met.
Some of this ambition already appears to be materialising, with installations of solar power expected to reach 75GW this year, while new targets under consideration would also give a further push to wind power installations after record additions at the end of 2020.