Analysis: China’s CO2 emissions surged past pre-coronavirus levels in May
China’s CO2 emissions have surged back from the coronavirus lockdown, rising by 4-5% year-on-year in May, analysis of new government data shows.
Emissions fell an estimated 25% in the six weeks following the lockdown, from early February to mid-March, before bottoming out, as factories and power plants reduced output. Road and air traffic also fell dramatically.
But the latest data shows the rebound in emissions has been rapid, as evidenced by the return of air pollution to pre-crisis levels.
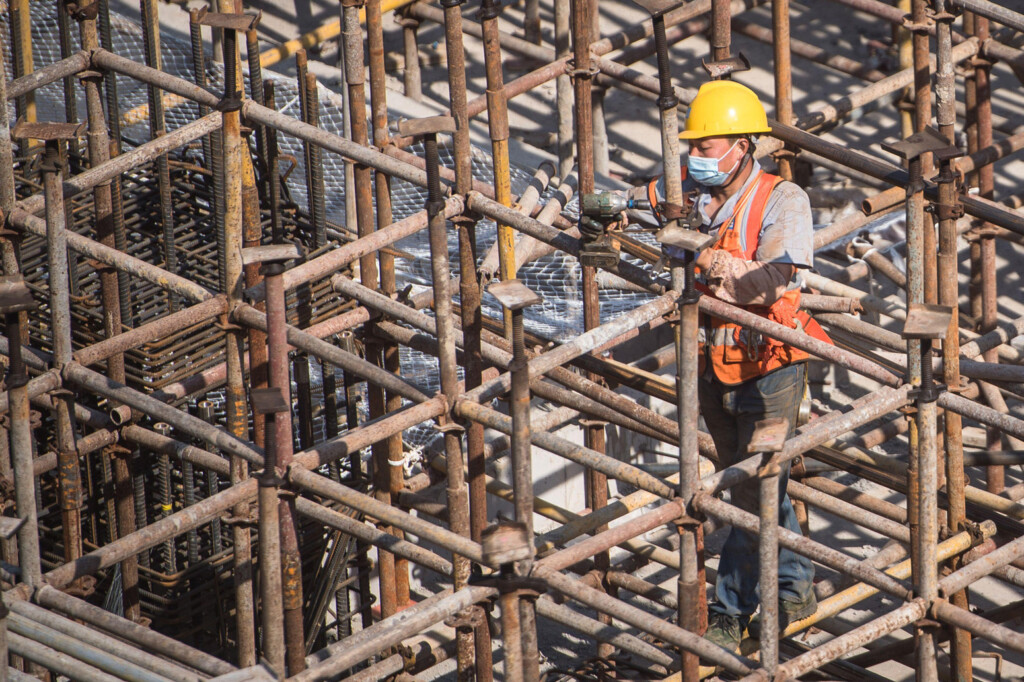
The increase in CO2 in May was driven by coal power, cement and other heavy industries, which appear to be bouncing back faster than other sectors of the economy. This is prompting concerns about the global implications of a coal-heavy recovery in China.
However, the latest data shows China’s CO2 emissions in 2020 to date remain some 6% below 2019 levels. With China having dropped its GDP target for the first time in 30 years – but also shelving “green” goals – question marks remain over the path of emissions this year.
China’s emissions rebound
Following an unprecedented 25% drop in China’s CO2 emissions during the coronavirus lockdown, a rebound was always likely.
The latest official data shows the rebound has been rapid, with China’s fossil CO2 emissions increasing by around 4-5% year-on-year in May. The chart below shows monthly emissions in 2020 with a red line, while 2019 figures are in blue.
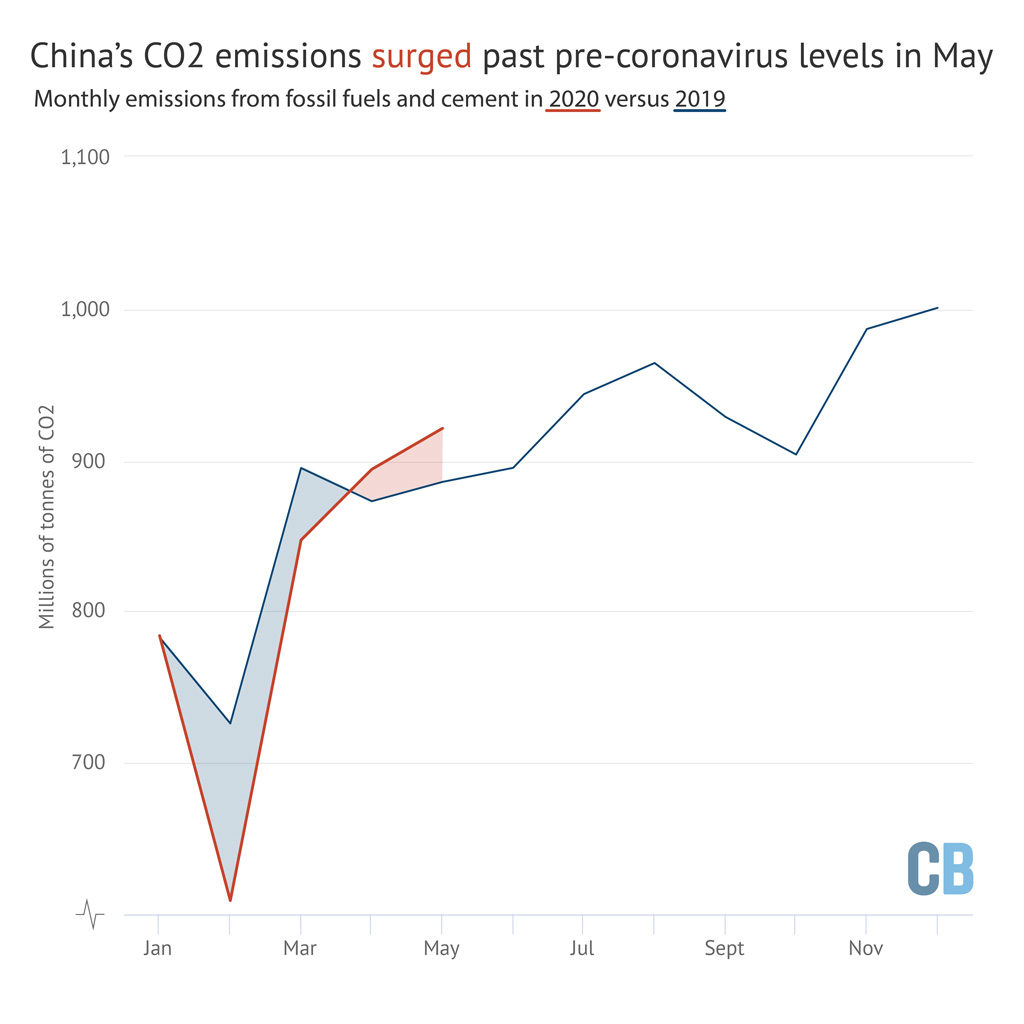
China’s total monthly CO2 emissions are calculated from detailed sector-by-sector data on apparent coal and coke consumption, and on total oil and gas consumption from WIND Information, a Chinese financial data provider, and from National Bureau of Statistics cement production data. “Apparent consumption” is consumption calculated from fuel production, imports, exports and changes in inventories.
As discussed below, energy-intensive industrial and construction sectors appear to be recovering faster than less emitting services and consumption, but the surge could be short-lived. In 2020 to date, emissions are still down by around 6%.
Coal power and cement driving the increase
The biggest drivers of the overall increase in CO2 emissions in May were 9% increases in thermal power generation and in cement output.
Thermal (mainly coal-fired) power has rebounded much faster than overall power demand, as the chart below shows, due to weak installations of non-fossil energy since last summer and poor hydropower operating conditions this year.
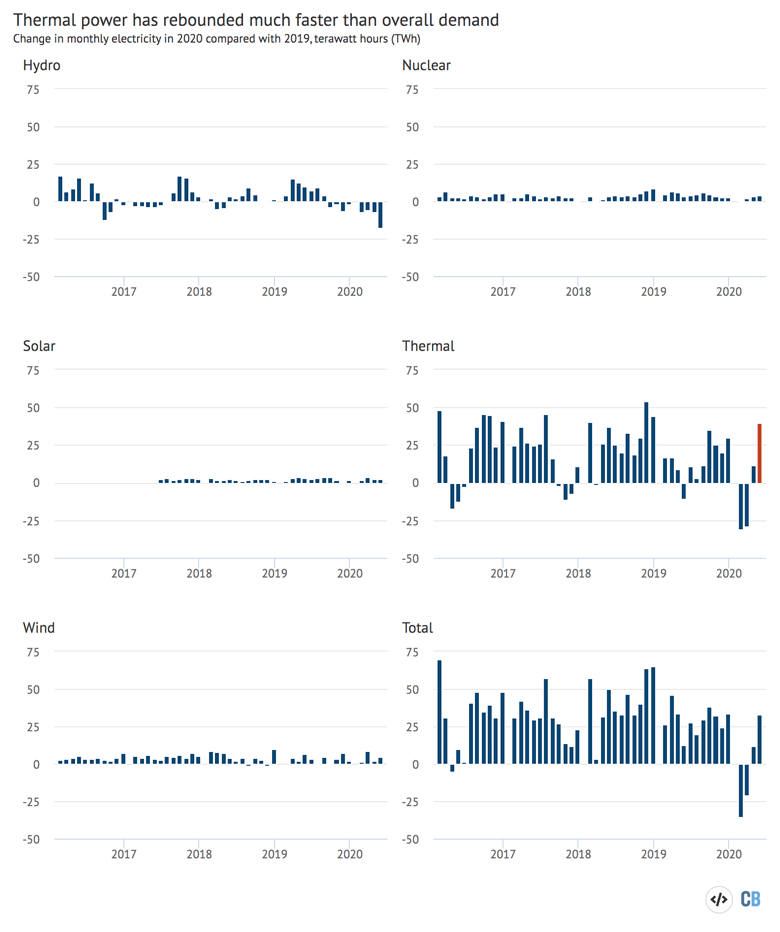
Year-on-year change in monthly electricity generation by source, terawatt hours. Source: CREA analysis of data from WIND Information. Chart by Carbon Brief using Highcharts.
Nuclear power generation increased by 14%, wind by 5% and solar by 7% year-on-year in May, but this was insufficient to offset the 17% drop in hydropower.
More recent daily data, covering five major generating firms, shows that the surge in coal power output during May had abated during the first half of June, when consumption of the fuel was slightly below levels seen in the same month last year.
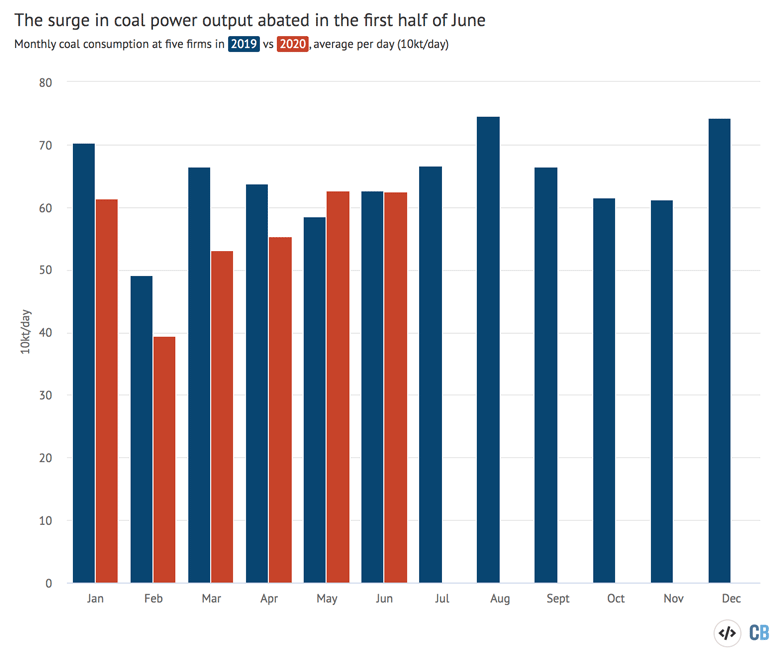
Coal consumption of five generating firms in China, in tonnes per day, shown as averages for each month in 2019 and 2020. Source: CREA analysis of data from WIND Information. Chart by Carbon Brief using Highcharts.
Beyond the power sector, cement production also increased dramatically in May, as the chart below shows. This accounted for one fifth of the overall increase in monthly CO2 emissions compared to last year.
However, cement output is still down in the year to date, meaning much of the growth in April and May represents catch-up after production was interrupted by lockdown.
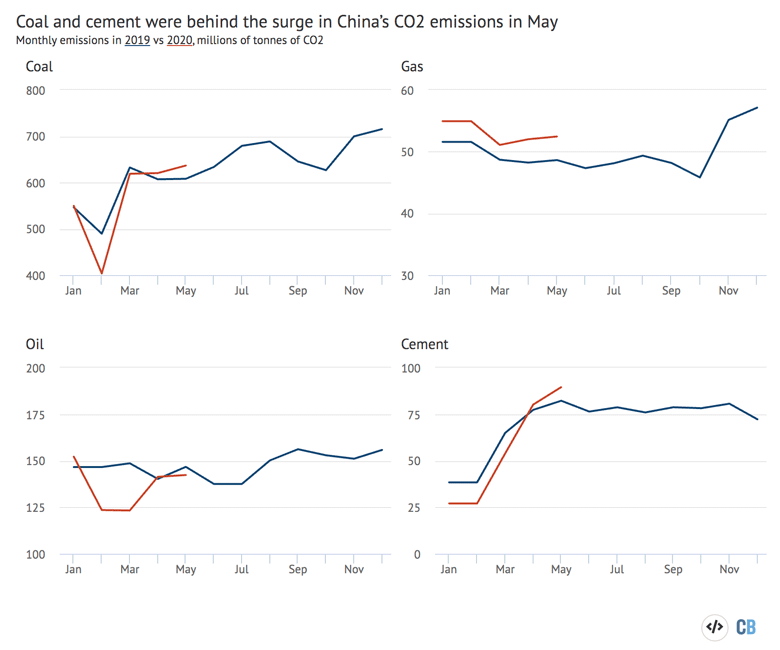
Monthly CO2 emissions from fossil fuels and cement in China, millions of tonnes of CO2 (MtCO2), in 2019 (blue) versus 2020 (red). Source: CREA analysis of data from WIND Information and China’s National Bureau of Statistics. Chart by Carbon Brief using Highcharts.
Cement demand is driven by real estate and infrastructure investment, which are yet to fully recover. It is not clear yet if the jump in May represents short term catch-up growth or a more profound increase in construction volumes.
Stimulus announcements have been more measured than the markets initially expected, but actual growth of borrowing has come in above expectations.
Oil demand has returned to last year’s levels, but has yet to record annual growth overall. Within that, the data shows that diesel use has risen strongly due to demand from freight and industry. The shift from public transport to private cars among commuters has also increased petrol demand, even as mobility remains muted.
Imports and refinery output are at near-record levels, however, as the petrochemical industry seeks to take advantage of low oil prices, supporting the global oil market. Chinese buyers have stockpiled oil to the point where storage capacity is full. This means imports are likely to weaken as inventories reach capacity.
Fossil gas demand, which has been growing at around 10% in recent years, plummeted in February, with consumption in the first two months of the year posting a mere 1% increase on the same period in 2019. Demand bottomed in March with the early introduction of lower off-season pricing and resumption of industrial activity, with April demand increasing 9%.
Power sector: coal plants greenlighted
While China’s CO2 emissions surged in May, the total for 2020 to date remains below last year’s levels and the prospects for the rest of the year and beyond are uncertain.
In an indication that high-emission projects are being launched to prop up the economy, coal-plant permitting accelerated to 40 gigawatts (GW) in the first half of year. This is the most since the huge wave of permits in 2015 and four times the total coal-fired capacity of the UK.
[contentbox id=”33730″]
However, central government has started to push back: a six-ministry joint policy paper was released in June telling provinces to prioritise clean energy, cross-province transmission and flexibility measures, instead of approving more coal power plants.
Overall investment in power generation is picking up – capital spending on utilities grew 14% year on year in January–May, even as overall capital spending fell by 6%. This shows the power sector is likely to be a key contributor to restarting investment spending after the Covid-19 crisis.
Where this power-sector investment goes – whether into more coal capacity or into networks and cleaner sources – has long-ranging implications for energy and emissions.
The renewable energy sector is projecting that the increase in spending will revive wind- and solar-power installations, which tumbled last year.
Before disruptions due to Covid-19, solar PV installations were expected to increase by up to 50% this year, regaining the drop in installations in 2019 when solar tariffs were cut. After the Covid-19 lockdowns, the industry is still projecting a 15-30% gain to 35-40GW installed.
Combined total wind and solar capacity additions in 2020 could climb by 25% year-on-year to around 70GW.
Will the emissions rebound last?
Much of the rebound in bulk industrial output has been propelled by the hope of a flood of stimulus money for construction and industrial projects. This is clear in steel demand, which has shifted heavily from steel products used in manufacturing to construction materials.

However, the Beijing leadership does seem to seek a more balanced economic response to the crisis instead of going all-out on construction stimulus. This is evidenced by the unusual decision to drop a GDP growth target from the government workplan, as well as shifting emphasis to jobs and meeting the needs of the population. If the expected flood of stimulus projects fails to materialise, smokestack industries will need to scale back output again.
The decision to de-emphasise the type of construction stimulus that China launched after the global financial crisis a decade ago does not seem motivated by environmental concerns, as a slew of environmental and emissions targets were also dropped.
A more likely motivation is preserving policy flexibility amid concerns about urban job creation and high debt levels – problems that are not solved by building more underutilised industrial parks in inland regions. Chinese leaders, unlike many others around the world, have also not articulated an explicit emphasis on “green recovery”.
However, if the rest of the economy remains weak and financial pressures mount, policymakers could feel compelled to boost carbon-intensive stimulus spending push the pedal to the floor.
There are already concerns that stimulus of such sectors could endanger the energy intensity target in the nation’s 2016-2020 five-year plan. This still requires a cut in energy intensity this year, meaning energy consumption growth should be slower than GDP growth.