Analysis: China’s post-lockdown emissions surge shows signs of cooling
Lauri Myllyvirta
08.13.21Lauri Myllyvirta
13.08.2021 | 8:00amChina’s carbon dioxide (CO2) emissions grew by around 1% in the second quarter of 2021 compared to a year earlier, new analysis for Carbon Brief shows.
This is a marked slowdown from the first quarter of the year, when emissions grew at their fastest pace in more than a decade as the economy bounced back from the coronavirus pandemic on a wave of growth in construction, steel and cement production.
The slowdown includes a 16% fall in demand for diesel year-on-year and 3% drop for oil products overall, with only modest growth of 1% for cement and 3% for coal power. These shifts appear to reflect steps the government has taken to control financial vulnerabilities, particularly in the real estate sector, as well as to rein in further rapid increase in steel production.
The analysis is based on official figures for the domestic production, import and export of fossil fuels and cement, as well as commercial data on changes in stocks of stored fuel.
The figures come as China works to flesh out its “dual carbon” pledges to peak emissions by 2030 and reach “carbon neutrality” by 2060. Upcoming plans from the central government, due to be published this year or early next, include peak emissions strategies for the iron and steel sector, as well as the economy overall, plus an action plan for the energy sector.
At the same time, separate analysis published by the Centre for Research on Energy and Clean Air (CREA) and Global Energy Monitor (GEM) shows that companies in China’s two largest CO2-emitting sectors – power and iron and steel – have continued to announce new investments in coal-based capacity, pointing to a continued mismatch with the country’s emissions goals.
Slowing emissions growth
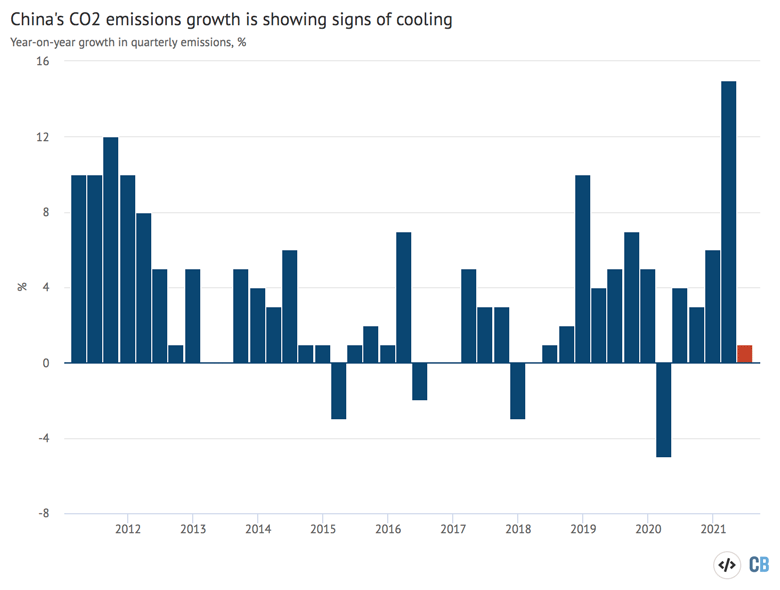
In the second quarter of 2021, CO2 emissions increased by 1% compared with the same period in 2020 and by 5% compared with the pre-pandemic levels of 2019, the new analysis shows. (See: Data sources).
While emissions kept climbing, the growth is a marked slowdown from the first quarter, when emissions were up 9% from 2019 levels and 15% year-on-year.
The slowdown is shown in the chart below, with year-on-year emissions growth in the most recent quarter marked in red and previous quarterly growth shown in blue.

The growth in CO2 emissions in the second quarter was entirely due to the increased use of coal for power generation and increased use of fossil gas across all sectors, as emissions from coal use outside the power sector, from cement manufacturing and oil consumption, stopped growing.
This is shown in the chart, below, where contributions to the emissions growth are broken down by fuel (indicated by different colours) and by sector (rows).

In the second quarter, consumption of thermal coal – used for electricity production, as well as in industrial boilers and to heat buildings – increased by 3%, compared to 20% annual growth in the first quarter of 2021.
The production of coke fell by 1% year-on-year, after increasing 9% in the first quarter. Meanwhile, the consumption of oil products fell 3% in the second quarter, led by diesel, which plummeted 16%, following respective increases of 17% and 12% in the first quarter.
Notably, consumption of fossil gas continued to boom, increasing 25% year-on-year in the second quarter of 2021. Annual growth in cement production, another major source of CO2 emissions, slowed from 47% in the first quarter to just 1% in the second quarter.
Coal demand growth came entirely from the power sector, where electricity demand growth, in turn, was driven by heavy industry, with steel, other metals, cement, glass and chemicals manufacturing responsible for the largest increases.
The most significant turnarounds happened in primary steelmaking, cement production and consumption of diesel, which is mainly used for bulk freight.
These are all intimately linked to the construction sector, which has been affected by moves by the government to reduce the amount of new credit available, targeting real estate in particular. Furthermore, local governments have been intervening to limit steel production, in line with the target set in late 2020 of limiting 2021 steel output to 2020 levels.
Local governments have been imposing strict output restrictions, which affected steel plant operations during the summer, but a recent Politburo instruction to avoid “campaign-style” emission reduction measures was widely seen as a rebuke to these curbs. (See Carbon Brief’s recent explainer about this development.)
Additionally, a sharp increase in crude steel production in the first half of the year means production in the second half would need to fall by approximately 11% to meet the target.
The expectation now is that a new, less restrictive target to limit output will be put in place. A less strict target would still mean putting an end to the roughly 10% growth rate of steel output seen during the past 12 months.
Aligning investments
In apparent contrast with the leadership’s call to “resolutely contain high energy-consumption, high-emissions projects”, the power and steel sectors have continued to announce plans for new coal-based power and steel projects in the first half of 2021.
Analysis from the Centre for Research on Energy and Clean Air (CREA) and Global Energy Monitor (GEM), also published today, tracks announcements in these sectors in 2021 to date.
The analysis found announcements for 18 new blast furnace projects, with a total capacity of 35m tonnes per year, as well as 43 new coal-fired power units, totalling 24 gigawatts (GW). If these projects are approved and built, they would be expected to emit an estimated 150m tonnes of CO2 (MtCO2) a year, equivalent to the entire annual emissions of the Netherlands.
Under China’s iron and steel capacity control rules, new projects “replace” retiring capacity so total capacity does not increase, but old plants close to retirement are replaced by new equipment.
According to the latest requirements, the air pollution priority regions should require 1.5 tonnes of old capacity to be closed down for every tonne of new capacity they authorise, up from 1.25.
In practice, however, the CREA/GEM mapping found that the ratio was around 0.9-1.1 tonnes closed for every tonne permitted in all the provinces, including in 2020–21, meaning little-to-no net reduction in capacity to date. There is also a major problem of illegally operating and illegally built capacity.
The steel industry’s proposed emissions targets would mean a substantial fall in the demand for pig iron produced in blast furnaces over this decade.
This means replacing retiring blast furnaces with new ones on a nearly 1:1 basis risks creating overcapacity, with the operators of new facilities facing financial distress if they are unable to run their factories at expected output.
This could then put pressure on the government to slow down the transition, or even institute a new round of domestic stimulus to support heavy industry.
In the power sector, however, there are signs of a shift in the mix of new capacity being built. Major power firms said in a survey that 91% of their new generation investments went into non-fossil capacity early in the year.
The solar industry expects investments and installations to recover from a slow start to 2021, leading to around 60GW of capacity installed this year. Solar panel manufacturing has been surging, posting a 51% increase in the first half of the year, lending credence to the forecast.
If the expectations can be met, the second half of the year would see the mix of added power capacity align better with the country’s climate goals – as well as a target to install 90GW of wind and solar during 2021.
Climate plans
China’s climate envoy Xie Zhenhua recently revealed that the top-level design for the country’s climate effort will be released soon and described the key features.
Besides the headline emissions targets for 2030 and 2060, the plan will include: targets and plans for increasing clean energy and reducing fossil energy and coal; industrial optimisation and upgrading; energy-saving and low-carbon buildings; low-carbon transportation systems; circular economy and resource efficiency; technological innovation; green finance; fiscal, taxation, pricing and other enabling economic policies; improving the carbon market; and implementing nature-based solutions.
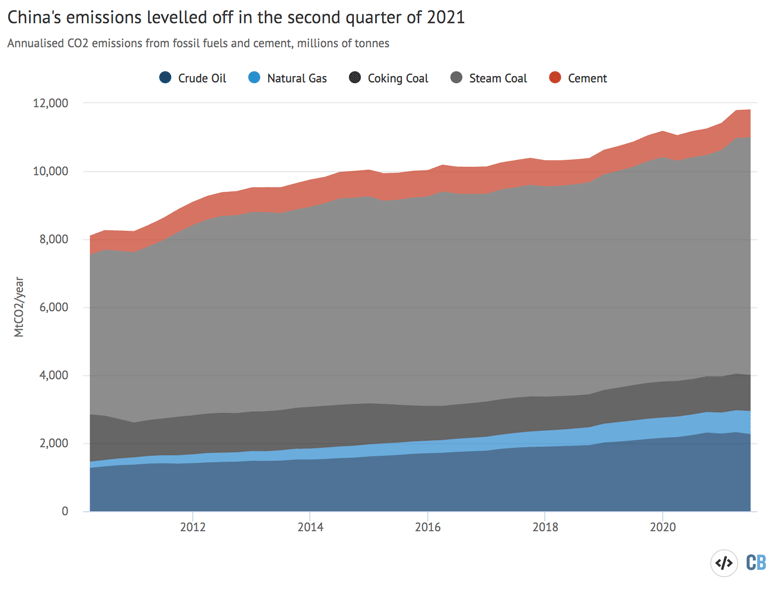
The scale of the challenge is illustrated by the chart below, which shows that annualised emissions across the Chinese economy have continued to steadily increase in recent years – albeit with a levelling off in the second quarter of 2021.

Some of the sector-specific plans are also becoming clearer, with the steel sector reportedly targeting an emissions peak before 2025 and a 30% reduction from peak by 2030. As one of the high-emission sectors, the power industry is expected to peak its emissions ahead of the national peak, which is targeted before 2030, but the debate about a specific date is still ongoing.
A new Politburo directive on reducing carbon emissions has sent mixed messages, receiving divergent interpretations over what it means for China’s level of ambition.
The directive called on one hand for “resolutely containing” high-energy, high-emissions projects, and on the other hand warned against “campaign-style” measures to reduce emissions, while urging the government to issue a CO2 peaking action plan as soon as possible.
The purpose could be interpreted as a directive to avoid overly heavy-handed interventions in steel production, electricity consumption and so on, in the name of cutting emissions, in favour of a more carefully planned transition.
However, the directive also told party officials to “establish before breaking”, indicating, according to some experts, that now is the time to build clean infrastructure rather than curbing high-emitting activities.
In response to the directive, state media and experts have warned against “unrealistic pledges” and emphasised that reaching carbon neutrality is a “long-term task”.
These statements have been interpreted in some quarters as the country’s leadership “softening its tone on climate ambition”. Others disagree and emphasise that they signal an end to ad-hoc responses in favour of the introduction of strict, top-level planning to meet the targets.
Ultimately, the directive can be read as a signal that the pace of China’s low-carbon transition will be controlled by the central government alone.
Data sources
Data for the analysis was compiled from the National Bureau of Statistics of China, National Energy Administration of China, China Electricity Council and China Customs official data releases, and from WIND Information, an industry data provider.
When data was available from multiple sources, different sources were cross-referenced and official sources used when possible, adjusting data from WIND Information to match.
Sign up to Carbon Brief's free "China Briefing" email newsletter. All you need to know about the latest developments relating to China and climate change. Sent to your inbox every Thursday.
CO2 emissions estimates are based on National Bureau of Statistics default calorific values of fuels and IPCC default emissions factors. Cement CO2 emissions factor is based on 2018 data.
For oil consumption, only data on oil products consumption was available so crude oil consumption is estimated from production and imports.
When official releases did not provide changes from 2019 to 2021, these are calculated from the linked release and previous iterations of the same regular release, although only the latest one is linked to.

